
Monitoring .-.. ... ..-. (IBM Spectrum LSF) with the TIG stack
Much like dashboards in automobiles, dashboards in the context of HPC infrastructure are crucial to get an understanding of what’s happening under the hood of your HPC cluster - at a glance. During my IT career, I’ve used a myriad of monitoring solutions ranging from SNMP and Ganglia, to the ELK (Elasticsearch, Logstash, Kibana) stack. For example, I’ve recently written an overview on how it is possible to visualize IBM Spectrum LSF (LSF) data in Grafana. LSF is an HPC job scheduler which brings to the table three decades of experience in workload and resource management.
For this blog, I decided to take this to the next level by monitoring IBM Spectrum LSF with the well known TIG (Telegraf, InfluxDB, Grafana) stack. This article is not meant to be a debate on the advantages of one monitoring stack over another. Rather, the focus is to demonstrate what is feasible in terms of monitoring Spectrum LSF clusters with the TIG stack, given the many available ways to query LSF for key information using CLI commands.
The Journey
There already exists many write-ups on how to deploy the TIG stack to monitor systems. This isn’t meant to be a guide on setting up the TIG stack. Rather, it’s assumed that the reader already has some familiarity with the TIG stack. If not, then [insert your favourite search engine] is your friend.
On my home network, I decided to setup a VM running on my trusty Traverse Ten64 running Fedora where InfluxDB was installed. The idea was to run InfluxDB on a system that is guaranteed to be always on in my home environment and that is energy efficient. Installing telegraf on all of the LSF cluster servers (x3) proved to be straight forward. Note that in all cases, I used the OS supplied versions of InfluxDB, Telegraf. Finally, I already had a Grafana server running on a server in my network.
Out of the box, Telegraf has the ability to monitor numerous system metrics. Furthermore, there exists literally hundreds of plugins for Telegraf to monitor a wide variety of devices, services and software. A search however, didn’t reveal the existence of any plugin to monitor LSF. So it was time to get creative.
What to monitor?
A bit of research revealed that InfluxDB supports what is known as “line protocol”. This is a well defined text-based format for writing data to InfluxDB. I used the following reference on “line protocol” to guide me. Using line protocol it would be ultimately possible to write a plugin for Telegraf to effecively scrape information from Spectrum LSF and output in line protocol format for writing to InfluxDB.
Before I could begin writing the plugin, the key was to determine what information from Spectrum LSF would be useful to display in the dashboard, and how that information could be extracted. For this I followed the KISS principle to keep things as simple as possible. The key metrics I decided to report on were servers, queues and jobs (oh my!), as well as process information for the LSF scheduler daemons. Refer to the following table for details:
| Metric(s) | Command |
|---|---|
| LSF scheduler performance metrics | badmin perfmon view -json |
| LSF available servers, CPUs, cores, slots | badmin showstatus |
| LSF server by status (total number Ok, closed, unreachable, unavailable) | badmin showstatus |
| LSF job statistics (total number running, suspended, pending) | badmin showstatus |
| LSF queue statistics (per queue, total number of jobs running, suspended, pending) | bqueues -json -o queue_name:12 njobs pend run susp rsv ususp ssusp |
| LSF mbatchd process metrics | (Telegraf - inputs.procstat) |
| LSF mbschd process metrics | (Telegraf - inputs.procstat) |
| LSF management lim process metrics | (Telegraf - inputs.procstat) |
Scrapin' fun
These above metrics would give a good idea of the state of the Spectrum LSF cluster at a glance. With the list of metrics prepared, the next step was to create a plugin script which would scrape data from the noted commands. Both bqueues and badmin perfmon view support output in JSON format with the appropriate flags specified. However, badmin showstatus does not support output in JSON format. This meant that for badmin showstatus it was necessary to scrape data assuming hard coded field positions in the output.
A copy of the Telegraf plugin for Spectrum LSF is provided below. This is just an example and is provided “as is” for testing purposes. Your mileage may vary.
Example lsf_telegraf_agent.py script. Click to expand!
#!/usr/bin/python3.8

# Copyright International Business Machines Corp, 2023
#
# Licensed under the Apache License, Version 2.0 (the "License");
# you may not use this file except in compliance with the License.
# You may obtain a copy of the License at
#
#    http://www.apache.org/licenses/LICENSE-2.0
#
# Unless required by applicable law or agreed to in writing, software
# distributed under the License is distributed on an "AS IS" BASIS,
# WITHOUT WARRANTIES OR CONDITIONS OF ANY KIND, either express or implied.
# See the License for the specific language governing permissions and
# limitations under the License.

#
# script: lsf_telegraf_agent.py
# version: 0.9
# Sample inputs.exec script for Telegraf which outputs metrics from an
# IBM Spectrum LSF management node in InfluxDB Line Protocol input format.
#
# NOTE: It is required to set the lsf_envfile variable to point to the
# LSF profile.lsf file for the given LSF installation.
#

import os
import json
import time
import subprocess
import sys
from pathlib import Path

#
# Variable declarations
# **NOTE: lsf_envfile needs to be set to point to the profile.lsf file for the LSF installation.
#
lsf_envfile = "/opt/ibm/lsfsuite/lsf/conf/profile.lsf"

#
# Source the Spectrum LSF profile.
# Check for existing of lsf_envfile (profile.lsf) and source the environment.
# If the specified file does not exist, then exit.
#
path = Path(lsf_envfile)
if path.is_file():
    lsf_env = (f'env -i sh -c "source {lsf_envfile} && env"')
    for line in subprocess.getoutput(lsf_env).split("\n"):
        key, value = line.split("=")
        os.environ[key]= value
else:
    sys.exit(f'The file {lsf_envfile} does not exist.')

#
# Get the time in nanoseconds since the epoch.
# This is required as part of the InfluxDB line protocol reference.
# Only supported on Python 3.7+
#
time_nanosec = time.time_ns()

#
# Here we set the LSF environment variable LSB_NTRIES. This will be used to determine the
# number of retries before failure of a LSF batch command. This is used to cover the case
# when the LSF mbatchd is not running.
#
os.environ["LSB_NTRIES"] = "2"

#
# Check if LSF performance metric monitoring is enabled. This is done by running
# 'badmin perfmon view'. If badmin is not found, then exit.
#
# Check the return status from 'badmin perfmon view' and take the appropriate action:
#  - If return status is 7, it means that performance monitoring is not enabled. The script
#    will enable LSF performance metric monitoring by running 'badmin perfmon start'.
#    Note that a 70 second sleep is required before LSF metrics will be available.
#  - If return status is 65, it means that the badmin command reported that the
#    LSF batch system is down. This is a fatal error which will cause the script
#    to exit.
#
lsf_path = os.environ['LSF_BINDIR']
badmin_path = lsf_path + "/badmin"
bqueues_path = lsf_path + "/bqueues"

path = Path(badmin_path)
if path.is_file():
    cmd = [badmin_path, 'perfmon', 'view']
    p = subprocess.Popen(cmd, stdout=subprocess.DEVNULL, stderr=subprocess.DEVNULL)
    while p.poll() is None:
        time.sleep(0.1)
    return_code = p.returncode
    if return_code == 7:
        cmd = [badmin_path, 'perfmon', 'start']
        p = subprocess.Popen(cmd, stdout=subprocess.DEVNULL, stderr=subprocess.DEVNULL)
        while p.poll() is None:
            time.sleep(0.1)
        return_code = p.returncode
        time.sleep(70)
    elif return_code == 65:
        sys.exit(f'The LSF batch system is down.')
else:
    sys.exit(f'{badmin_path} does not exist.')

#
# Run badmin with the "perfmon view" keywords and the -json option to product JSON output
# We assume here that the LSF batch system is responsive (a check was done above); if
# the mbatchd is very busy there is a possiblity that it may not be responsive here. This
# case is not considered; LSB_NTRIES setting will determine how many tries are made before
# badmin gives up the ghost.
#
# Note: We previously checked for the existence of the 'badmin' binary.
#
cmd = [badmin_path, 'perfmon', 'view', '-json']
p = subprocess.Popen(cmd, stdout=subprocess.PIPE, stderr=subprocess.DEVNULL, text=True)
stdout, stderr = p.communicate()
#
# Guard for the case that the performance monitor has just been enabled, but is not
# producing any data as the first sample period has not elapsed.
#
if stdout == "":
    sys.exit(f'Output from badmin perfmon view -json is empty.')
else:
    data = json.loads(stdout)

#
# Run badmin showstatus
# Next, run the command 'badmin showstatus' and capture the output. Note that badmin showstatus
# does not produce JSON output. So here we must do some scraping of the output.
# The output from 'badmin showstatus' it placed into the array 'showstatus'. The hard coded
# positions in the output of 'badmin showstatus' are assumed when building the output
# strings below. Should the format of the output of 'badmin showstatus' change, this will
# need to be updated.
cmd = [badmin_path, 'showstatus']
p = subprocess.Popen(cmd, stdout=subprocess.PIPE, stderr=subprocess.DEVNULL, text=True)
stdout, stderr = p.communicate()
# Convert badmin showstatus output into an array
showstatus = stdout.split()

#
# Run bqueues
#
cmd = [bqueues_path, '-json', '-o', 'queue_name:12 njobs pend run susp rsv ususp ssusp']
p = subprocess.Popen(cmd, stdout=subprocess.PIPE, stderr=subprocess.DEVNULL, text=True)
stdout, stderr = p.communicate()
data_queues = json.loads(stdout)

#
# At this stage, we've captured the output from 'badmin perfmon view -json' and
# 'badmin showstatus'. We're now ready to print to standard output the metric
# strings in InfluxDB line procotol format.
#
# Details about the line protocol format can be found here:
# https://docs.influxdata.com/influxdb/v2.6/reference/syntax/line-protocol/
#
#

#
# LSF server status
#
print("lsf_servers,","status=total"," value=",showstatus[21],"i ",time_nanosec,sep='')
print("lsf_servers,","status=ok"," value=",showstatus[23],"i ",time_nanosec,sep='')
print("lsf_servers,","status=closed"," value=",showstatus[25],"i ",time_nanosec,sep='')
print("lsf_servers,","status=unreachable"," value=",showstatus[27],"i ",time_nanosec,sep='')
print("lsf_servers,","status=unavailable"," value=",showstatus[29],"i ",time_nanosec,sep='')

#
# LSF job status
#
print("lsf_jobs,","state=total"," value=",showstatus[33],"i ",time_nanosec,sep='')
print("lsf_jobs,","state=running"," value=",showstatus[35],"i ",time_nanosec,sep='')
print("lsf_jobs,","state=suspended"," value=",showstatus[37],"i ",time_nanosec,sep='')
print("lsf_jobs,","state=pending"," value=",showstatus[39],"i ",time_nanosec,sep='')
print("lsf_jobs,","state=finished"," value=",showstatus[41],"i ",time_nanosec,sep='')

#
# LSF user stats
#
print("lsf_users,","state=numusers"," value=",showstatus[45],"i ",time_nanosec,sep='')
print("lsf_users,","state=numgroups"," value=",showstatus[50],"i ",time_nanosec,sep='')
print("lsf_users,","state=numactive"," value=",showstatus[55],"i ",time_nanosec,sep='')

#
# LSF hosts stats
# First we split out the current and peak values for clients, servers, cpus, cores, and slots.
# The current and peak values are separated by the "/" delimiter.
#
clientssplit = showstatus[9].split("/")
serverssplit = showstatus[11].split("/")
cpussplit = showstatus[13].split("/")
coressplit = showstatus[15].split("/")
slotssplit = showstatus[17].split("/")

print("lsf_hosts,","state=clients"," current=",clientssplit[0],"i,","peak=",clientssplit[1],"i ",time_n
anosec,sep='')
print("lsf_hosts,","state=servers"," current=",serverssplit[0],"i,","peak=",serverssplit[1],"i ",time_n
anosec,sep='')
print("lsf_hosts,","state=cpus"," current=",cpussplit[0],"i,","peak=",cpussplit[1],"i ",time_nanosec,se
p='')
print("lsf_hosts,","state=cores"," current=",coressplit[0],"i,","peak=",coressplit[1],"i ",time_nanosec
,sep='')
print("lsf_hosts,","state=slots"," current=",slotssplit[0],"i,","peak=",slotssplit[1],"i ",time_nanosec
,sep='')

#
# Print mbatchd query metrics
#
print("lsf_mbatchd,","query=job"," value=",data['record'][1]['current'],"i ",time_nanosec,sep='')
print("lsf_mbatchd,","query=host"," value=",data['record'][2]['current'],"i ",time_nanosec,sep='')
print("lsf_mbatchd,","query=queue"," value=",data['record'][3]['current'],"i ",time_nanosec,sep='')

#
# Print mbatchd job metrics
#
print("lsf_mbatchd,","jobs=submitreqs"," value=",data['record'][4]['current'],"i ",time_nanosec,sep='')
print("lsf_mbatchd,","jobs=submitted"," value=",data['record'][5]['current'],"i ",time_nanosec,sep='')
print("lsf_mbatchd,","jobs=dispatched"," value=",data['record'][6]['current'],"i ",time_nanosec,sep='')
print("lsf_mbatchd,","jobs=completed"," value=",data['record'][7]['current'],"i ",time_nanosec,sep='')
print("lsf_mbatchd,","jobs=sentremote"," value=",data['record'][8]['current'],"i ",time_nanosec,sep='')
print("lsf_mbatchd,","jobs=acceptremote"," value=",data['record'][9]['current'],"i ",time_nanosec,sep='
')
print("lsf_mbatchd,","sched=interval"," value=",data['record'][10]['current'],"i ",time_nanosec,sep='')
print("lsf_mbatchd,","sched=matchhost"," value=",data['record'][11]['current'],"i ",time_nanosec,sep=''
)
print("lsf_mbatchd,","sched=buckets"," value=",data['record'][12]['current'],"i ",time_nanosec,sep='')
print("lsf_mbatchd,","sched=reordered"," value=",data['record'][13]['current'],"i ",time_nanosec,sep=''
)

#
# Print mbatchd efficiency metrics. Here check if the efficiency metric indicated is "-". If so,
# then assume a zero value. The trailing "%" sign on the metrics (percentages) is also stripped here.
#
slots = (data['record'][14]['current'])
slots_percent = slots
if slots_percent == "-":
    slots_percent = "0"
elif slots_percent != "0":
    # Strip % sign and decimal. This is to work around issue inserting float to InfluxDB
    # "type float, already exists as type integer dropped ..."
    slots_percent = slots[:-4]

memory = (data['record'][15]['current'])
memory_percent = memory
if memory_percent == "-":
    memory_percent = "0"
elif memory_percent != "0":
    # Strip % sign and decimal. This is to work around issue inserting float to InfluxDB
    # "type float, already exists as type integer dropped ..."
    memory_percent = memory[:-4]

print("lsf_mbatchd,","utilization=slots"," value=",slots_percent,"i ",time_nanosec,sep='')
print("lsf_mbatchd,","utilization=memory"," value=",memory_percent,"i ",time_nanosec,sep='')

#
# Print mbatchd file descriptor usage
#
print("lsf_mbatchd,","fd=free"," value=",data['fd']['free'],"i ",time_nanosec,sep='')
print("lsf_mbatchd,","fd=used"," value=",data['fd']['used'],"i ",time_nanosec,sep='')
print("lsf_mbatchd,","fd=total"," value=",data['fd']['total'],"i ",time_nanosec,sep='')

#
# Print LSF queue status (njobs)
#
iterations = data_queues["QUEUES"]

for n in range(iterations):
    print("lsf_queues,","name=", data_queues['RECORDS'][n]['QUEUE_NAME'], " njobs=", data_queues['RECOR
DS'][n]['NJOBS'],"i,",
          "pend=", data_queues['RECORDS'][n]['PEND'],"i,",
          "run=", data_queues['RECORDS'][n]['RUN'],"i,",
          "susp=", data_queues['RECORDS'][n]['SUSP'],"i,",
          "rsv=", data_queues['RECORDS'][n]['RSV'],"i,",
          "ususp=", data_queues['RECORDS'][n]['USUSP'],"i,",
          "ssusp=", data_queues['RECORDS'][n]['SSUSP'],"i ",
          time_nanosec, sep='')

exit()
Bringing it all together
For completeness, below is the detail regarding the configuration of the environment. It should be noted that the simple test environment consists of a single server running IBM Spectrum LSF Suite for HPC and a separate server which runs the InfluxDB instance.
| Hostname | Component | Version |
|---|---|---|
| kilenc | OS (LSF mgmt server) | CentOS Stream release 8 (ppc64le) |
| kilenc | Spectrum LSF Suite for HPC | v10.2.0.13 |
| adatbazis | OS (InfluxDB server) | Fedora release 36 (aarch64) |
| adatbazis | InfluxDB | v1.8.10 |
| kilenc | Telegraf | v1.24.3 |
| kilenc | Grafana | v9.1.6 |
The following steps assume that IBM Spectrum LSF Suite for HPC, InfluxDB and Telegraf have been installed.
-
Start InfluxDB on the host adatbazis
-
On the LSF management server kilenc, configure telegraf to connect to the influxDB instance on host adatbazis. Edit the configuration /etc/telegraf/telegraf.conf and specify the correct URL in the outputs.influxdb section as follows:
# # Configuration for sending metrics to InfluxDB
[[outputs.influxdb]]
#   ## The full HTTP or UDP URL for your InfluxDB instance.
#   ##
#   ## Multiple URLs can be specified for a single cluster, only ONE of the
#   ## urls will be written to each interval.
#   # urls = ["unix:///var/run/influxdb.sock"]
#   # urls = ["udp://127.0.0.1:8089"]
#   # urls = ["http://127.0.0.1:8086"]
# Added gsamu Jan 04 2023
urls = ["http://adatbazis:8086"]- On the LSF management server kilenc, configure telegraf with the custom plugin script lsf_telegraf_agent.py to collect and log metrics from IBM Spectrum LSF Suite for HPC. Edit the configuration /etc/telegraf/telegraf.conf and specify the correct command path in the section inputs.exec. Additionally, set data_format equal to influx.Note that the script lsf_telegraf_agent.py was copied to the directory /etc/telegraf/telegraf.d/scripts with permissions octal 755 and owner set to user telegraf. Note: User telegraf was automatically created during the installation of telegraf.
# ## Gather LSF metrics
[[inputs.exec]]
  ## Commands array
   commands = [  "/etc/telegraf/telegraf.d/scripts/lsf_telegraf_agent.py" ]
   timeout = "30s"
   interval = "30s"
   data_format = "influx"
# ## End LSF metrics- Telegraf provides the ability to collect metrics on processes. Here we’ll use the telegraf procstat facility to monitor the LSF mbatchd and mbschd processes. These are the key daemons involved in handling query requests and making scheduling decisions for jobs in the environment. Edit the configuration /etc/telegraf/telegraf.conf and configure the two following inputs.procstat sections.
# ## Monitor CPU and memory utilization for LSF processes
# ## mbatchd, mbschd, lim (manager)
[[inputs.procstat]]
exe = "lim"
pattern = "lim"
pid_finder = "pgrep"

[[inputs.procstat]]
exe = "mbschd"
pattern = "mbschd"
pid_finder = "pgrep"

[[inputs.procstat]]
exe = "mbatchd"
pattern = "mbatchd"
pid_finder = "pgrep"- With the configuration to telegraf complete, it’s now time to test if the configuration and custom LSF agent is functioning as expected. Note that the following operation is performed on the LSF management candidate host kilenc and assumes that the LSF daemons are up and running. This is achieve by running the command: telegraf –config /etc/telegraf/telegraf.conf –test. Note: Any errors in the configuration file /etc/telegraf/telegraf.conf will result in errors in the output.
Output of telegraf –config /etc/telegraf/telegraf.conf –test. Click to expand!
[root@kilenc telegraf]# pwd
/etc/telegraf
[root@kilenc telegraf]# telegraf --config /etc/telegraf/telegraf.conf --test
> mem,host=kilenc active=1938817024i,available=6820003840i,available_percent=20.653390597462806,buffered=4849664i,cached=6317735936i,commit_limit=33560395776i,committed_as=18635292672i,dirty=4128768i,free=2623799296i,high_free=0i,high_total=0i,huge_page_size=2097152i,huge_pages_free=0i,huge_pages_total=0i,inactive=13852016640i,low_free=0i,low_total=0i,mapped=1007353856i,page_tables=22478848i,shared=259063808i,slab=4946919424i,sreclaimable=902234112i,sunreclaim=4044685312i,swap_cached=3866624i,swap_free=16994729984i,swap_total=17049780224i,total=33021231104i,used=24074846208i,used_percent=72.90717336424115,vmalloc_chunk=0i,vmalloc_total=562949953421312i,vmalloc_used=0i,write_back=0i,write_back_tmp=0i 1674246976000000000
> kernel,host=kilenc boot_time=1673790850i,context_switches=1943864437i,entropy_avail=4037i,interrupts=1294179599i,processes_forked=4255316i 1674246976000000000
> swap,host=kilenc free=16994729984i,total=17049780224i,used=55050240i,used_percent=0.3228794698626609 1674246976000000000
> swap,host=kilenc in=172032i,out=851968i 1674246976000000000
> net,host=kilenc,interface=lo bytes_recv=90039931116i,bytes_sent=90039931116i,drop_in=0i,drop_out=0i,err_in=0i,err_out=0i,packets_recv=17245997i,packets_sent=17245997i 1674246976000000000
> net,host=kilenc,interface=enP4p1s0f0 bytes_recv=0i,bytes_sent=0i,drop_in=0i,drop_out=0i,err_in=0i,err_out=0i,packets_recv=0i,packets_sent=0i 1674246976000000000
> net,host=kilenc,interface=enP4p1s0f1 bytes_recv=11791041280i,bytes_sent=1701152001i,drop_in=0i,drop_out=0i,err_in=0i,err_out=0i,packets_recv=10322276i,packets_sent=4594948i 1674246976000000000
> net,host=kilenc,interface=all icmp_inaddrmaskreps=0i,icmp_inaddrmasks=0i,icmp_incsumerrors=0i,icmp_indestunreachs=8609i,icmp_inechoreps=20i,icmp_inechos=11i,icmp_inerrors=1084i,icmp_inmsgs=8640i,icmp_inparmprobs=0i,icmp_inredirects=0i,icmp_insrcquenchs=0i,icmp_intimeexcds=0i,icmp_intimestampreps=0i,icmp_intimestamps=0i,icmp_outaddrmaskreps=0i,icmp_outaddrmasks=0i,icmp_outdestunreachs=4805i,icmp_outechoreps=11i,icmp_outechos=94i,icmp_outerrors=0i,icmp_outmsgs=4910i,icmp_outparmprobs=0i,icmp_outredirects=0i,icmp_outsrcquenchs=0i,icmp_outtimeexcds=0i,icmp_outtimestampreps=0i,icmp_outtimestamps=0i,icmpmsg_intype0=20i,icmpmsg_intype3=8609i,icmpmsg_intype8=11i,icmpmsg_outtype0=11i,icmpmsg_outtype3=4805i,icmpmsg_outtype8=94i,ip_defaultttl=64i,ip_forwarding=1i,ip_forwdatagrams=0i,ip_fragcreates=62958i,ip_fragfails=0i,ip_fragoks=12611i,ip_inaddrerrors=1i,ip_indelivers=21324370i,ip_indiscards=0i,ip_inhdrerrors=0i,ip_inreceives=21324371i,ip_inunknownprotos=0i,ip_outdiscards=0i,ip_outnoroutes=30i,ip_outrequests=21248264i,ip_reasmfails=0i,ip_reasmoks=0i,ip_reasmreqds=0i,ip_reasmtimeout=0i,tcp_activeopens=763497i,tcp_attemptfails=96617i,tcp_currestab=118i,tcp_estabresets=1917i,tcp_incsumerrors=0i,tcp_inerrs=0i,tcp_insegs=19488475i,tcp_maxconn=-1i,tcp_outrsts=137188i,tcp_outsegs=20220038i,tcp_passiveopens=675805i,tcp_retranssegs=9827i,tcp_rtoalgorithm=1i,tcp_rtomax=120000i,tcp_rtomin=200i,udp_ignoredmulti=10509i,udp_incsumerrors=0i,udp_indatagrams=1816997i,udp_inerrors=0i,udp_memerrors=0i,udp_noports=264i,udp_outdatagrams=1506724i,udp_rcvbuferrors=0i,udp_sndbuferrors=0i,udplite_ignoredmulti=0i,udplite_incsumerrors=0i,udplite_indatagrams=0i,udplite_inerrors=0i,udplite_memerrors=0i,udplite_noports=0i,udplite_outdatagrams=0i,udplite_rcvbuferrors=0i,udplite_sndbuferrors=0i 1674246976000000000
> diskio,host=kilenc,name=dm-2 io_time=9739370i,iops_in_progress=0i,merged_reads=0i,merged_writes=0i,read_bytes=4015612416i,read_time=604060i,reads=40592i,weighted_io_time=60563370i,write_bytes=47025459712i,write_time=59959310i,writes=1079691i 1674246976000000000
> diskio,host=kilenc,name=sda1 io_time=1460i,iops_in_progress=0i,merged_reads=0i,merged_writes=0i,read_bytes=4849664i,read_time=1304i,reads=67i,weighted_io_time=1304i,write_bytes=0i,write_time=0i,writes=0i 1674246976000000000
> diskio,host=kilenc,name=sda3 io_time=45872430i,iops_in_progress=0i,merged_reads=623i,merged_writes=1061314i,read_bytes=16398521856i,read_time=3371612i,reads=139298i,weighted_io_time=311521720i,write_bytes=133715422208i,write_time=308150107i,writes=7031512i 1674246976000000000
> diskio,host=kilenc,name=dm-1 io_time=5780i,iops_in_progress=0i,merged_reads=0i,merged_writes=0i,read_bytes=5636096i,read_time=3030i,reads=81i,weighted_io_time=26500i,write_bytes=13631488i,write_time=23470i,writes=208i 1674246976000000000
> disk,device=dm-0,fstype=xfs,host=kilenc,mode=rw,path=/ free=9315028992i,inodes_free=18214222i,inodes_total=19822888i,inodes_used=1608666i,total=53660876800i,used=44345847808i,used_percent=82.64093032486566 1674246976000000000
> disk,device=sda2,fstype=ext4,host=kilenc,mode=rw,path=/boot free=309653504i,inodes_free=65264i,inodes_total=65536i,inodes_used=272i,total=1020702720i,used=640585728i,used_percent=67.41310045173972 1674246976000000000
> disk,device=dm-2,fstype=xfs,host=kilenc,mode=rw,path=/home free=856442515456i,inodes_free=452529686i,inodes_total=453312512i,inodes_used=782826i,total=927930712064i,used=71488196608i,used_percent=7.704044674735306 1674246976000000000
> disk,device=dm-2,fstype=xfs,host=kilenc,mode=rw,path=/home/opt/at13.0/lib free=856442515456i,inodes_free=452529686i,inodes_total=453312512i,inodes_used=782826i,total=927930712064i,used=71488196608i,used_percent=7.704044674735306 1674246976000000000
> disk,device=dm-2,fstype=xfs,host=kilenc,mode=rw,path=/home/opt/at13.0/lib64 free=856442515456i,inodes_free=452529686i,inodes_total=453312512i,inodes_used=782826i,total=927930712064i,used=71488196608i,used_percent=7.704044674735306 1674246976000000000
> disk,device=ST31000524AS/raktar,fstype=zfs,host=kilenc,mode=rw,path=/mnt/ST31000524AS free=210837438464i,inodes_free=411792117i,inodes_total=412304487i,inodes_used=512370i,total=965496143872i,used=754658705408i,used_percent=78.16278813725106 1674246976000000000
> diskio,host=kilenc,name=sda io_time=45899860i,iops_in_progress=0i,merged_reads=650i,merged_writes=1061332i,read_bytes=16495536128i,read_time=3440899i,reads=141325i,weighted_io_time=311596362i,write_bytes=133715696640i,write_time=308155462i,writes=7031531i 1674246976000000000
> disk,device=ST31000524AS,fstype=zfs,host=kilenc,mode=rw,path=/ST31000524AS free=210837438464i,inodes_free=411792117i,inodes_total=411792123i,inodes_used=6i,total=210837569536i,used=131072i,used_percent=0.00006216728844316324 1674246976000000000
> diskio,host=kilenc,name=sda2 io_time=18060i,iops_in_progress=0i,merged_reads=27i,merged_writes=18i,read_bytes=88372224i,read_time=31224i,reads=436i,weighted_io_time=36579i,write_bytes=274432i,write_time=5355i,writes=19i 1674246976000000000
> diskio,host=kilenc,name=dm-0 io_time=38788720i,iops_in_progress=0i,merged_reads=0i,merged_writes=0i,read_bytes=12341294080i,read_time=1143210i,reads=51814i,weighted_io_time=303329620i,write_bytes=86676331008i,write_time=302186410i,writes=6798400i 1674246976000000000
> diskio,host=kilenc,name=sdb io_time=668810i,iops_in_progress=0i,merged_reads=9i,merged_writes=58i,read_bytes=104550912i,read_time=746540i,reads=31054i,weighted_io_time=1445858i,write_bytes=10845920256i,write_time=699318i,writes=124780i 1674246976000000000
> diskio,host=kilenc,name=sdb1 io_time=341330i,iops_in_progress=0i,merged_reads=0i,merged_writes=58i,read_bytes=95562240i,read_time=383066i,reads=25026i,weighted_io_time=1082385i,write_bytes=10845920256i,write_time=699318i,writes=124780i 1674246976000000000
> diskio,host=kilenc,name=sdb9 io_time=190i,iops_in_progress=0i,merged_reads=0i,merged_writes=0i,read_bytes=4980736i,read_time=37i,reads=69i,weighted_io_time=37i,write_bytes=0i,write_time=0i,writes=0i 1674246976000000000
> system,host=kilenc load1=2.06,load15=2.12,load5=2.12,n_cpus=32i,n_users=0i 1674246976000000000
> system,host=kilenc uptime=456127i 1674246976000000000
> system,host=kilenc uptime_format="5 days,  6:42" 1674246976000000000
> processes,host=kilenc blocked=1i,dead=0i,idle=569i,paging=0i,parked=1i,running=0i,sleeping=412i,stopped=0i,total=1366i,total_threads=2683i,unknown=0i,zombies=0i 1674246976000000000
> lsf_servers,host=kilenc,status=total value=1i 1674246976000000000
> lsf_servers,host=kilenc,status=ok value=1i 1674246976000000000
> lsf_servers,host=kilenc,status=closed value=0i 1674246976000000000
> lsf_servers,host=kilenc,status=unreachable value=0i 1674246976000000000
> lsf_servers,host=kilenc,status=unavailable value=0i 1674246976000000000
> lsf_jobs,host=kilenc,state=total value=121776i 1674246976000000000
> lsf_jobs,host=kilenc,state=running value=32i 1674246976000000000
> lsf_jobs,host=kilenc,state=suspended value=0i 1674246976000000000
> lsf_jobs,host=kilenc,state=pending value=120771i 1674246976000000000
> lsf_jobs,host=kilenc,state=finished value=973i 1674246976000000000
> lsf_users,host=kilenc,state=numusers value=4i 1674246976000000000
> lsf_users,host=kilenc,state=numgroups value=1i 1674246976000000000
> lsf_users,host=kilenc,state=numactive value=1i 1674246976000000000
> lsf_hosts,host=kilenc,state=clients current=0i,peak=0i 1674246976000000000
> lsf_hosts,host=kilenc,state=servers current=1i,peak=1i 1674246976000000000
> lsf_hosts,host=kilenc,state=cpus current=2i,peak=2i 1674246976000000000
> lsf_hosts,host=kilenc,state=cores current=32i,peak=32i 1674246976000000000
> lsf_hosts,host=kilenc,state=slots current=32i,peak=32i 1674246976000000000
> lsf_mbatchd,host=kilenc,query=job value=0i 1674246976000000000
> lsf_mbatchd,host=kilenc,query=host value=0i 1674246976000000000
> lsf_mbatchd,host=kilenc,query=queue value=2i 1674246976000000000
> lsf_mbatchd,host=kilenc,jobs=submitreqs value=0i 1674246976000000000
> lsf_mbatchd,host=kilenc,jobs=submitted value=0i 1674246976000000000
> lsf_mbatchd,host=kilenc,jobs=dispatched value=19i 1674246976000000000
> lsf_mbatchd,host=kilenc,jobs=completed value=12i 1674246976000000000
> lsf_mbatchd,host=kilenc,jobs=sentremote value=0i 1674246976000000000
> lsf_mbatchd,host=kilenc,jobs=acceptremote value=0i 1674246976000000000
> lsf_mbatchd,host=kilenc,sched=interval value=1i 1674246976000000000
> lsf_mbatchd,host=kilenc,sched=matchhost value=5i 1674246976000000000
> lsf_mbatchd,host=kilenc,sched=buckets value=5i 1674246976000000000
> lsf_mbatchd,host=kilenc,sched=reordered value=7i 1674246976000000000
> lsf_mbatchd,host=kilenc,utilization=slots value=100i 1674246976000000000
> lsf_mbatchd,host=kilenc,utilization=memory value=0i 1674246976000000000
> lsf_mbatchd,fd=free,host=kilenc value=65509i 1674246976000000000
> lsf_mbatchd,fd=used,host=kilenc value=26i 1674246976000000000
> lsf_mbatchd,fd=total,host=kilenc value=65535i 1674246976000000000
> lsf_queues,host=kilenc,name=admin njobs=0i,pend=0i,rsv=0i,run=0i,ssusp=0i,susp=0i,ususp=0i 1674246976000000000
> lsf_queues,host=kilenc,name=owners njobs=0i,pend=0i,rsv=0i,run=0i,ssusp=0i,susp=0i,ususp=0i 1674246976000000000
> lsf_queues,host=kilenc,name=priority njobs=93951i,pend=93923i,rsv=0i,run=28i,ssusp=0i,susp=0i,ususp=0i 1674246976000000000
> lsf_queues,host=kilenc,name=night njobs=0i,pend=0i,rsv=0i,run=0i,ssusp=0i,susp=0i,ususp=0i 1674246976000000000
> lsf_queues,host=kilenc,name=short njobs=2504i,pend=2504i,rsv=0i,run=0i,ssusp=0i,susp=0i,ususp=0i 1674246976000000000
> lsf_queues,host=kilenc,name=dataq njobs=0i,pend=0i,rsv=0i,run=0i,ssusp=0i,susp=0i,ususp=0i 1674246976000000000
> lsf_queues,host=kilenc,name=normal njobs=1750i,pend=1750i,rsv=0i,run=0i,ssusp=0i,susp=0i,ususp=0i 1674246976000000000
> lsf_queues,host=kilenc,name=interactive njobs=0i,pend=0i,rsv=0i,run=0i,ssusp=0i,susp=0i,ususp=0i 1674246976000000000
> lsf_queues,host=kilenc,name=sendq njobs=22598i,pend=22594i,rsv=0i,run=4i,ssusp=0i,susp=0i,ususp=0i 1674246976000000000
> lsf_queues,host=kilenc,name=idle njobs=0i,pend=0i,rsv=0i,run=0i,ssusp=0i,susp=0i,ususp=0i 1674246976000000000
> cpu,cpu=cpu0,host=kilenc usage_guest=0,usage_guest_nice=0,usage_idle=100,usage_iowait=0,usage_irq=0,usage_nice=0,usage_softirq=0,usage_steal=0,usage_system=0,usage_user=0 1674246977000000000
> cpu,cpu=cpu4,host=kilenc usage_guest=0,usage_guest_nice=0,usage_idle=100,usage_iowait=0,usage_irq=0,usage_nice=0,usage_softirq=0,usage_steal=0,usage_system=0,usage_user=0 1674246977000000000
> cpu,cpu=cpu8,host=kilenc usage_guest=0,usage_guest_nice=0,usage_idle=100,usage_iowait=0,usage_irq=0,usage_nice=0,usage_softirq=0,usage_steal=0,usage_system=0,usage_user=0 1674246977000000000
> cpu,cpu=cpu12,host=kilenc usage_guest=0,usage_guest_nice=0,usage_idle=100,usage_iowait=0,usage_irq=0,usage_nice=0,usage_softirq=0,usage_steal=0,usage_system=0,usage_user=0 1674246977000000000
> cpu,cpu=cpu16,host=kilenc usage_guest=0,usage_guest_nice=0,usage_idle=98.03921568448419,usage_iowait=0,usage_irq=0,usage_nice=0,usage_softirq=0,usage_steal=0,usage_system=0,usage_user=1.9607843137324836 1674246977000000000
> cpu,cpu=cpu20,host=kilenc usage_guest=0,usage_guest_nice=0,usage_idle=100,usage_iowait=0,usage_irq=0,usage_nice=0,usage_softirq=0,usage_steal=0,usage_system=0,usage_user=0 1674246977000000000
> cpu,cpu=cpu24,host=kilenc usage_guest=0,usage_guest_nice=0,usage_idle=100,usage_iowait=0,usage_irq=0,usage_nice=0,usage_softirq=0,usage_steal=0,usage_system=0,usage_user=0 1674246977000000000
> cpu,cpu=cpu28,host=kilenc usage_guest=0,usage_guest_nice=0,usage_idle=100,usage_iowait=0,usage_irq=0,usage_nice=0,usage_softirq=0,usage_steal=0,usage_system=0,usage_user=0 1674246977000000000
> cpu,cpu=cpu32,host=kilenc usage_guest=0,usage_guest_nice=0,usage_idle=100,usage_iowait=0,usage_irq=0,usage_nice=0,usage_softirq=0,usage_steal=0,usage_system=0,usage_user=0 1674246977000000000
> cpu,cpu=cpu36,host=kilenc usage_guest=0,usage_guest_nice=0,usage_idle=100,usage_iowait=0,usage_irq=0,usage_nice=0,usage_softirq=0,usage_steal=0,usage_system=0,usage_user=0 1674246977000000000
> cpu,cpu=cpu40,host=kilenc usage_guest=0,usage_guest_nice=0,usage_idle=98.03921568448419,usage_iowait=0,usage_irq=0,usage_nice=0,usage_softirq=0,usage_steal=0,usage_system=1.9607843136879006,usage_user=0 1674246977000000000
> cpu,cpu=cpu44,host=kilenc usage_guest=0,usage_guest_nice=0,usage_idle=100,usage_iowait=0,usage_irq=0,usage_nice=0,usage_softirq=0,usage_steal=0,usage_system=0,usage_user=0 1674246977000000000
> cpu,cpu=cpu48,host=kilenc usage_guest=0,usage_guest_nice=0,usage_idle=100,usage_iowait=0,usage_irq=0,usage_nice=0,usage_softirq=0,usage_steal=0,usage_system=0,usage_user=0 1674246977000000000
> cpu,cpu=cpu52,host=kilenc usage_guest=0,usage_guest_nice=0,usage_idle=0,usage_iowait=100,usage_irq=0,usage_nice=0,usage_softirq=0,usage_steal=0,usage_system=0,usage_user=0 1674246977000000000
> cpu,cpu=cpu56,host=kilenc usage_guest=0,usage_guest_nice=0,usage_idle=100,usage_iowait=0,usage_irq=0,usage_nice=0,usage_softirq=0,usage_steal=0,usage_system=0,usage_user=0 1674246977000000000
> cpu,cpu=cpu60,host=kilenc usage_guest=0,usage_guest_nice=0,usage_idle=100,usage_iowait=0,usage_irq=0,usage_nice=0,usage_softirq=0,usage_steal=0,usage_system=0,usage_user=0 1674246977000000000
> cpu,cpu=cpu64,host=kilenc usage_guest=0,usage_guest_nice=0,usage_idle=87.99999999906868,usage_iowait=0,usage_irq=0,usage_nice=0,usage_softirq=0,usage_steal=0,usage_system=10.000000001155058,usage_user=2.0000000002764864 1674246977000000000
> cpu,cpu=cpu68,host=kilenc usage_guest=0,usage_guest_nice=0,usage_idle=100,usage_iowait=0,usage_irq=0,usage_nice=0,usage_softirq=0,usage_steal=0,usage_system=0,usage_user=0 1674246977000000000
> cpu,cpu=cpu72,host=kilenc usage_guest=0,usage_guest_nice=0,usage_idle=86.27450980280263,usage_iowait=0,usage_irq=0,usage_nice=0,usage_softirq=0,usage_steal=0,usage_system=11.764705882127403,usage_user=1.9607843137324836 1674246977000000000
> cpu,cpu=cpu76,host=kilenc usage_guest=0,usage_guest_nice=0,usage_idle=100,usage_iowait=0,usage_irq=0,usage_nice=0,usage_softirq=0,usage_steal=0,usage_system=0,usage_user=0 1674246977000000000
> cpu,cpu=cpu80,host=kilenc usage_guest=0,usage_guest_nice=0,usage_idle=92.30769231113655,usage_iowait=0,usage_irq=0,usage_nice=0,usage_softirq=0,usage_steal=0,usage_system=3.8461538464431086,usage_user=3.84615384653056 1674246977000000000
> cpu,cpu=cpu84,host=kilenc usage_guest=0,usage_guest_nice=0,usage_idle=94.11764706486585,usage_iowait=0,usage_irq=0,usage_nice=0,usage_softirq=0,usage_steal=0,usage_system=0,usage_user=5.882352941197451 1674246977000000000
> cpu,cpu=cpu88,host=kilenc usage_guest=0,usage_guest_nice=0,usage_idle=100,usage_iowait=0,usage_irq=0,usage_nice=0,usage_softirq=0,usage_steal=0,usage_system=0,usage_user=0 1674246977000000000
> cpu,cpu=cpu92,host=kilenc usage_guest=0,usage_guest_nice=0,usage_idle=70.58823529344627,usage_iowait=0,usage_irq=0,usage_nice=0,usage_softirq=0,usage_steal=0,usage_system=29.411764701983955,usage_user=0 1674246977000000000
> cpu,cpu=cpu96,host=kilenc usage_guest=0,usage_guest_nice=0,usage_idle=96.15384615040192,usage_iowait=0,usage_irq=0,usage_nice=0,usage_softirq=0,usage_steal=0,usage_system=3.8461538460125784,usage_user=0 1674246977000000000
> cpu,cpu=cpu100,host=kilenc usage_guest=0,usage_guest_nice=0,usage_idle=97.99999999813735,usage_iowait=0,usage_irq=0,usage_nice=0,usage_softirq=0,usage_steal=0,usage_system=1.999999999998181,usage_user=0 1674246977000000000
> cpu,cpu=cpu104,host=kilenc usage_guest=0,usage_guest_nice=0,usage_idle=96.07843137993407,usage_iowait=0,usage_irq=0,usage_nice=0,usage_softirq=0,usage_steal=0,usage_system=3.92156862782338,usage_user=0 1674246977000000000
> cpu,cpu=cpu108,host=kilenc usage_guest=0,usage_guest_nice=0,usage_idle=96.07843136896838,usage_iowait=0,usage_irq=0,usage_nice=0,usage_softirq=0,usage_steal=0,usage_system=1.9607843136879006,usage_user=1.9607843137324836 1674246977000000000
> cpu,cpu=cpu112,host=kilenc usage_guest=0,usage_guest_nice=0,usage_idle=100,usage_iowait=0,usage_irq=0,usage_nice=0,usage_softirq=0,usage_steal=0,usage_system=0,usage_user=0 1674246977000000000
> cpu,cpu=cpu116,host=kilenc usage_guest=0,usage_guest_nice=0,usage_idle=95.91836734305988,usage_iowait=0,usage_irq=0,usage_nice=0,usage_softirq=0,usage_steal=0,usage_system=4.08163265313509,usage_user=0 1674246977000000000
> cpu,cpu=cpu120,host=kilenc usage_guest=0,usage_guest_nice=0,usage_idle=84.61538461280144,usage_iowait=0,usage_irq=0,usage_nice=0,usage_softirq=0,usage_steal=0,usage_system=3.8461538460344413,usage_user=11.53846153830009 1674246977000000000
> cpu,cpu=cpu124,host=kilenc usage_guest=0,usage_guest_nice=0,usage_idle=100,usage_iowait=0,usage_irq=0,usage_nice=0,usage_softirq=0,usage_steal=0,usage_system=0,usage_user=0 1674246977000000000
> cpu,cpu=cpu-total,host=kilenc usage_guest=0,usage_guest_nice=0,usage_idle=93.47826086554115,usage_iowait=3.1055900618243673,usage_irq=0,usage_nice=0,usage_softirq=0,usage_steal=0,usage_system=2.484472049468532,usage_user=0.9316770186919254 1674246977000000000
> procstat,exe=mbatchd,host=kilenc,process_name=mbatchd,user=root child_major_faults=0i,child_minor_faults=0i,cpu_time=0i,cpu_time_guest=0,cpu_time_guest_nice=0,cpu_time_idle=0,cpu_time_iowait=0,cpu_time_irq=0,cpu_time_nice=0,cpu_time_soft_irq=0,cpu_time_steal=0,cpu_time_system=0.03,cpu_time_user=0.05,cpu_usage=0,created_at=1674246974000000000i,involuntary_context_switches=1i,major_faults=0i,memory_data=834994176i,memory_locked=0i,memory_rss=815595520i,memory_stack=327680i,memory_swap=0i,memory_usage=2.469912528991699,memory_vms=1091108864i,minor_faults=726i,nice_priority=20i,num_fds=10i,num_threads=2i,pid=62056i,ppid=4103699i,read_bytes=0i,read_count=27i,realtime_priority=0i,rlimit_cpu_time_hard=9223372036854775807i,rlimit_cpu_time_soft=9223372036854775807i,rlimit_file_locks_hard=9223372036854775807i,rlimit_file_locks_soft=9223372036854775807i,rlimit_memory_data_hard=9223372036854775807i,rlimit_memory_data_soft=9223372036854775807i,rlimit_memory_locked_hard=67108864i,rlimit_memory_locked_soft=67108864i,rlimit_memory_rss_hard=9223372036854775807i,rlimit_memory_rss_soft=9223372036854775807i,rlimit_memory_stack_hard=9223372036854775807i,rlimit_memory_stack_soft=8388608i,rlimit_memory_vms_hard=9223372036854775807i,rlimit_memory_vms_soft=9223372036854775807i,rlimit_nice_priority_hard=0i,rlimit_nice_priority_soft=0i,rlimit_num_fds_hard=262144i,rlimit_num_fds_soft=65535i,rlimit_realtime_priority_hard=0i,rlimit_realtime_priority_soft=0i,rlimit_signals_pending_hard=118856i,rlimit_signals_pending_soft=118856i,signals_pending=0i,voluntary_context_switches=5i,write_bytes=0i,write_count=16i 1674246977000000000
> procstat,exe=mbschd,host=kilenc,process_name=mbschd,user=lsfadmin child_major_faults=0i,child_minor_faults=2457641i,cpu_time=320i,cpu_time_guest=0,cpu_time_guest_nice=0,cpu_time_idle=0,cpu_time_iowait=0.02,cpu_time_irq=0,cpu_time_nice=0,cpu_time_soft_irq=0,cpu_time_steal=0,cpu_time_system=8.4,cpu_time_user=312.14,cpu_usage=1.836645120693344,created_at=1674227581000000000i,involuntary_context_switches=3553i,major_faults=1i,memory_data=228851712i,memory_locked=0i,memory_rss=236847104i,memory_stack=196608i,memory_swap=0i,memory_usage=0.717257022857666,memory_vms=246808576i,minor_faults=2137969i,nice_priority=20i,num_fds=3i,num_threads=1i,pid=4103740i,ppid=4103699i,read_bytes=1552384i,read_count=936861i,realtime_priority=0i,rlimit_cpu_time_hard=9223372036854775807i,rlimit_cpu_time_soft=9223372036854775807i,rlimit_file_locks_hard=9223372036854775807i,rlimit_file_locks_soft=9223372036854775807i,rlimit_memory_data_hard=9223372036854775807i,rlimit_memory_data_soft=9223372036854775807i,rlimit_memory_locked_hard=67108864i,rlimit_memory_locked_soft=67108864i,rlimit_memory_rss_hard=9223372036854775807i,rlimit_memory_rss_soft=9223372036854775807i,rlimit_memory_stack_hard=9223372036854775807i,rlimit_memory_stack_soft=8388608i,rlimit_memory_vms_hard=9223372036854775807i,rlimit_memory_vms_soft=9223372036854775807i,rlimit_nice_priority_hard=0i,rlimit_nice_priority_soft=0i,rlimit_num_fds_hard=262144i,rlimit_num_fds_soft=65535i,rlimit_realtime_priority_hard=0i,rlimit_realtime_priority_soft=0i,rlimit_signals_pending_hard=118856i,rlimit_signals_pending_soft=118856i,signals_pending=0i,voluntary_context_switches=43952i,write_bytes=0i,write_count=42311i 1674246977000000000
> procstat_lookup,exe=mbschd,host=kilenc,pid_finder=pgrep,result=success pid_count=1i,result_code=0i,running=1i 1674246977000000000
> procstat,exe=mbatchd,host=kilenc,process_name=mbatchd,user=root child_major_faults=2i,child_minor_faults=4476280i,cpu_time=177i,cpu_time_guest=0,cpu_time_guest_nice=0,cpu_time_idle=0,cpu_time_iowait=6.68,cpu_time_irq=0,cpu_time_nice=0,cpu_time_soft_irq=0,cpu_time_steal=0,cpu_time_system=51.01,cpu_time_user=126.42,cpu_usage=0,created_at=1674227573000000000i,involuntary_context_switches=4993i,major_faults=3i,memory_data=834994176i,memory_locked=0i,memory_rss=827785216i,memory_stack=327680i,memory_swap=0i,memory_usage=2.5068273544311523,memory_vms=1091108864i,minor_faults=2406945i,nice_priority=20i,num_fds=26i,num_threads=3i,pid=4103699i,ppid=4103684i,read_bytes=21008384i,read_count=364726i,realtime_priority=0i,rlimit_cpu_time_hard=9223372036854775807i,rlimit_cpu_time_soft=9223372036854775807i,rlimit_file_locks_hard=9223372036854775807i,rlimit_file_locks_soft=9223372036854775807i,rlimit_memory_data_hard=9223372036854775807i,rlimit_memory_data_soft=9223372036854775807i,rlimit_memory_locked_hard=67108864i,rlimit_memory_locked_soft=67108864i,rlimit_memory_rss_hard=9223372036854775807i,rlimit_memory_rss_soft=9223372036854775807i,rlimit_memory_stack_hard=9223372036854775807i,rlimit_memory_stack_soft=8388608i,rlimit_memory_vms_hard=9223372036854775807i,rlimit_memory_vms_soft=9223372036854775807i,rlimit_nice_priority_hard=0i,rlimit_nice_priority_soft=0i,rlimit_num_fds_hard=262144i,rlimit_num_fds_soft=65535i,rlimit_realtime_priority_hard=0i,rlimit_realtime_priority_soft=0i,rlimit_signals_pending_hard=118856i,rlimit_signals_pending_soft=118856i,signals_pending=0i,voluntary_context_switches=172583i,write_bytes=1562181632i,write_count=12164760i 1674246977000000000
> procstat_lookup,exe=mbatchd,host=kilenc,pid_finder=pgrep,result=success pid_count=2i,result_code=0i,running=2i 1674246977000000000
- Assuming there were no errors in the previous step with telegraf, proceed to start the telegraf process via systemd.
[root@kilenc telegraf]# systemctl start telegraf
[root@kilenc telegraf]# systemctl status telegraf
● telegraf.service - Telegraf
   Loaded: loaded (/usr/lib/systemd/system/telegraf.service; enabled; vendor preset: disabled)
   Active: active (running) since Thu 2023-01-19 14:13:51 EST; 1 day 1h ago
     Docs: https://github.com/influxdata/telegraf
 Main PID: 3225959 (telegraf)
    Tasks: 35 (limit: 190169)
   Memory: 192.6M
   CGroup: /system.slice/telegraf.service
           └─3225959 /usr/bin/telegraf -config /etc/telegraf/telegraf.conf -config-directory /etc/tele>

Jan 19 14:13:51 kilenc systemd[1]: Starting Telegraf...
Jan 19 14:13:51 kilenc systemd[1]: Started Telegraf.- On the host running the database instance, adatbazis, perform queries to check whether the database telegraf exists, as well as checking if LSF related data is being logged. This is confirmed in the output below.
Output from InfluxDB queries. Click to expand!
[root@adatbazis fedora]# influx
Connected to https://localhost:8086 version 1.8.10
InfluxDB shell version: 1.8.10
> auth
username: influx
password:
> show databases
name: databases
name
----
_internal
telegraf
> use telegraf
Using database telegraf
> show field keys
name: cpu
fieldKey         fieldType
--------         ---------
usage_guest      float
usage_guest_nice float
usage_idle       float
usage_iowait     float
usage_irq        float
usage_nice       float
usage_softirq    float
usage_steal      float
usage_system     float
usage_user       float

name: disk
fieldKey     fieldType
--------     ---------
free         integer
inodes_free  integer
inodes_total integer
inodes_used  integer
total        integer
used         integer
used_percent float

name: diskio
fieldKey         fieldType
--------         ---------
io_time          integer
iops_in_progress integer
merged_reads     integer
merged_writes    integer
read_bytes       integer
read_time        integer
reads            integer
weighted_io_time integer
write_bytes      integer
write_time       integer
writes           integer

name: kernel
fieldKey         fieldType
--------         ---------
boot_time        integer
context_switches integer
entropy_avail    integer
interrupts       integer
processes_forked integer

name: lsf_hosts
fieldKey fieldType
-------- ---------
current  integer
peak     integer

name: lsf_jobs
fieldKey fieldType
-------- ---------
value    integer

name: lsf_mbatchd
fieldKey fieldType
-------- ---------
value    integer

name: lsf_queues
fieldKey fieldType
-------- ---------
njobs    integer
pend     integer
rsv      integer
run      integer
ssusp    integer
susp     integer
ususp    integer

name: lsf_servers
fieldKey fieldType
-------- ---------
value    integer

name: lsf_users
fieldKey fieldType
-------- ---------
value    integer

name: mem
fieldKey          fieldType
--------          ---------
active            integer
available         integer
available_percent float
buffered          integer
cached            integer
commit_limit      integer
committed_as      integer
dirty             integer
free              integer
high_free         integer
high_total        integer
huge_page_size    integer
huge_pages_free   integer
huge_pages_total  integer
inactive          integer
low_free          integer
low_total         integer
mapped            integer
page_tables       integer
shared            integer
slab              integer
sreclaimable      integer
sunreclaim        integer
swap_cached       integer
swap_free         integer
swap_total        integer
total             integer
used              integer
used_percent      float
vmalloc_chunk     integer
vmalloc_total     integer
vmalloc_used      integer
write_back        integer
write_back_tmp    integer

name: net
fieldKey              fieldType
--------              ---------
bytes_recv            integer
bytes_sent            integer
drop_in               integer
drop_out              integer
err_in                integer
err_out               integer
icmp_inaddrmaskreps   integer
icmp_inaddrmasks      integer
icmp_incsumerrors     integer
icmp_indestunreachs   integer
icmp_inechoreps       integer
icmp_inechos          integer
icmp_inerrors         integer
icmp_inmsgs           integer
icmp_inparmprobs      integer
icmp_inredirects      integer
icmp_insrcquenchs     integer
icmp_intimeexcds      integer
icmp_intimestampreps  integer
icmp_intimestamps     integer
icmp_outaddrmaskreps  integer
icmp_outaddrmasks     integer
icmp_outdestunreachs  integer
icmp_outechoreps      integer
icmp_outechos         integer
icmp_outerrors        integer
icmp_outmsgs          integer
icmp_outparmprobs     integer
icmp_outredirects     integer
icmp_outsrcquenchs    integer
icmp_outtimeexcds     integer
icmp_outtimestampreps integer
icmp_outtimestamps    integer
icmpmsg_intype0       integer
icmpmsg_intype3       integer
icmpmsg_intype8       integer
icmpmsg_outtype0      integer
icmpmsg_outtype3      integer
icmpmsg_outtype8      integer
ip_defaultttl         integer
ip_forwarding         integer
ip_forwdatagrams      integer
ip_fragcreates        integer
ip_fragfails          integer
ip_fragoks            integer
ip_inaddrerrors       integer
ip_indelivers         integer
ip_indiscards         integer
ip_inhdrerrors        integer
ip_inreceives         integer
ip_inunknownprotos    integer
ip_outdiscards        integer
ip_outnoroutes        integer
ip_outrequests        integer
ip_reasmfails         integer
ip_reasmoks           integer
ip_reasmreqds         integer
ip_reasmtimeout       integer
packets_recv          integer
packets_sent          integer
tcp_activeopens       integer
tcp_attemptfails      integer
tcp_currestab         integer
tcp_estabresets       integer
tcp_incsumerrors      integer
tcp_inerrs            integer
tcp_insegs            integer
tcp_maxconn           integer
tcp_outrsts           integer
tcp_outsegs           integer
tcp_passiveopens      integer
tcp_retranssegs       integer
tcp_rtoalgorithm      integer
tcp_rtomax            integer
tcp_rtomin            integer
udp_ignoredmulti      integer
udp_incsumerrors      integer
udp_indatagrams       integer
udp_inerrors          integer
udp_memerrors         integer
udp_noports           integer
udp_outdatagrams      integer
udp_rcvbuferrors      integer
udp_sndbuferrors      integer
udplite_ignoredmulti  integer
udplite_incsumerrors  integer
udplite_indatagrams   integer
udplite_inerrors      integer
udplite_memerrors     integer
udplite_noports       integer
udplite_outdatagrams  integer
udplite_rcvbuferrors  integer
udplite_sndbuferrors  integer

name: processes
fieldKey      fieldType
--------      ---------
blocked       integer
dead          integer
idle          integer
paging        integer
parked        integer
running       integer
sleeping      integer
stopped       integer
total         integer
total_threads integer
unknown       integer
zombies       integer

name: procstat
fieldKey                     fieldType
--------                     ---------
child_major_faults           integer
child_minor_faults           integer
cpu_time_guest               float
cpu_time_guest_nice          float
cpu_time_idle                float
cpu_time_iowait              float
cpu_time_irq                 float
cpu_time_nice                float
cpu_time_soft_irq            float
cpu_time_steal               float
cpu_time_system              float
cpu_time_user                float
cpu_usage                    float
created_at                   integer
involuntary_context_switches integer
major_faults                 integer
memory_data                  integer
memory_locked                integer
memory_rss                   integer
memory_stack                 integer
memory_swap                  integer
memory_usage                 float
memory_vms                   integer
minor_faults                 integer
num_threads                  integer
pid                          integer
ppid                         integer
voluntary_context_switches   integer

name: procstat_lookup
fieldKey    fieldType
--------    ---------
pid_count   integer
result_code integer
running     integer

name: swap
fieldKey     fieldType
--------     ---------
free         integer
in           integer
out          integer
total        integer
used         integer
used_percent float

name: system
fieldKey       fieldType
--------       ---------
load1          float
load15         float
load5          float
n_cpus         integer
n_unique_users integer
n_users        integer
uptime         integer
uptime_format  string
> select * from metrics
> SELECT * FROM "lsf_hosts";
name: lsf_hosts
time                current host   peak state
----                ------- ----   ---- -----
1674493170000000000 0       kilenc 0    clients
1674493170000000000 32      kilenc 32   slots
1674493170000000000 32      kilenc 32   cores
1674493170000000000 1       kilenc 1    servers
1674493170000000000 2       kilenc 2    cpus
1674493200000000000 1       kilenc 1    servers
1674493200000000000 2       kilenc 2    cpus
1674493200000000000 32      kilenc 32   slots
1674493200000000000 0       kilenc 0    clients
1674493200000000000 32      kilenc 32   cores
1674493230000000000 0       kilenc 0    clients
1674493230000000000 32      kilenc 32   cores
1674493230000000000 2       kilenc 2    cpus
1674493230000000000 1       kilenc 1    servers
1674493230000000000 32      kilenc 32   slots
1674493260000000000 1       kilenc 1    servers
1674493260000000000 32      kilenc 32   slots
1674493260000000000 0       kilenc 0    clients
1674493260000000000 2       kilenc 2    cpus
1674493260000000000 32      kilenc 32   cores
> quit
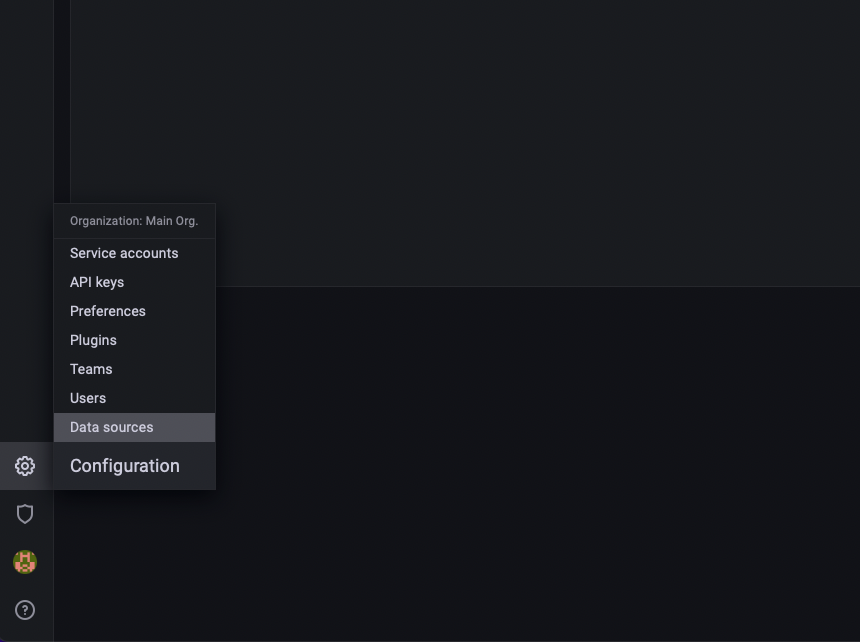
- With telegraf successfully logging data to the InfluxDB instance, it will now be possible to create a data source in Grafana in order to create a dashboard containing LSF metrics. As noted at the outset, this article is not meant to be an extensive guide to the creation of dashoards in Grafana. In the Grafana navigation select Configuration > Data sources.
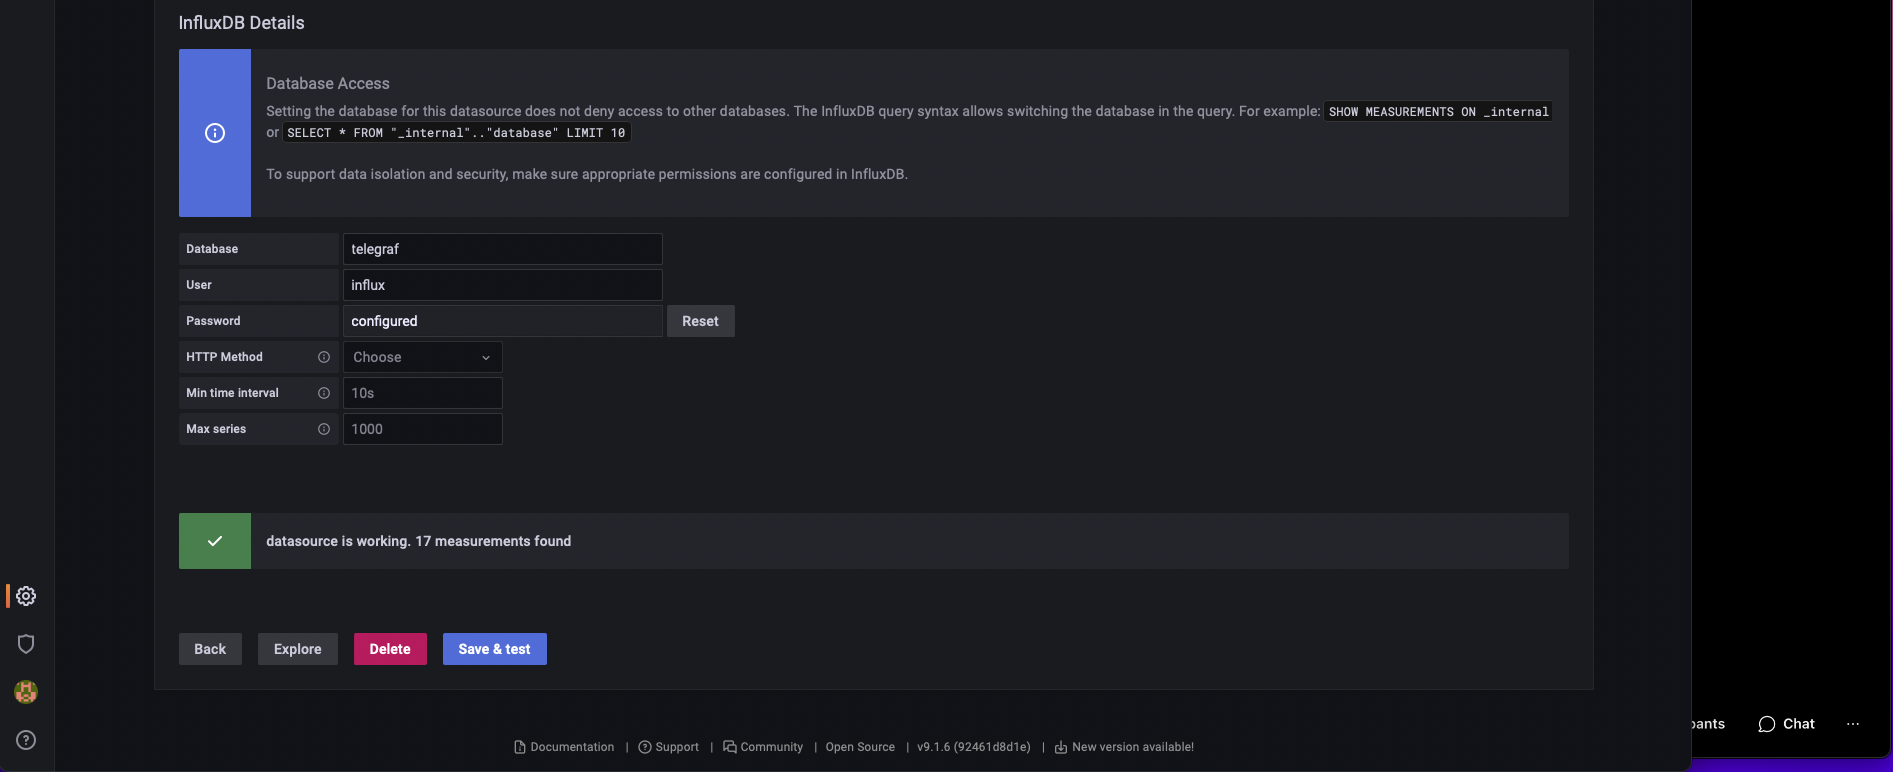
- Select the Add data source button, followed by InfluxDB, which is listed under Time series databases. On the settings page specify following values:
| Variable | Value |
|---|---|
| URL | http://adatbazis:8086 |
| Database | telegraf |
| Basic auth | (enable) |
| User | <influxdb_username> |
| Password | <influxdb_password |
Next, click on Save & test. If all variables and settings were properly specified, the message datasource is working. 17 measurements found.
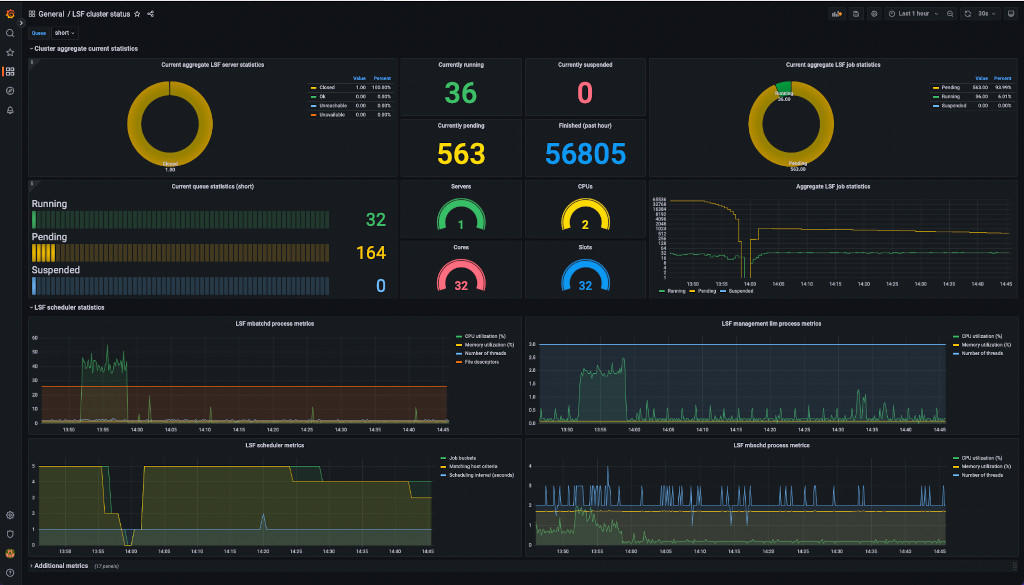
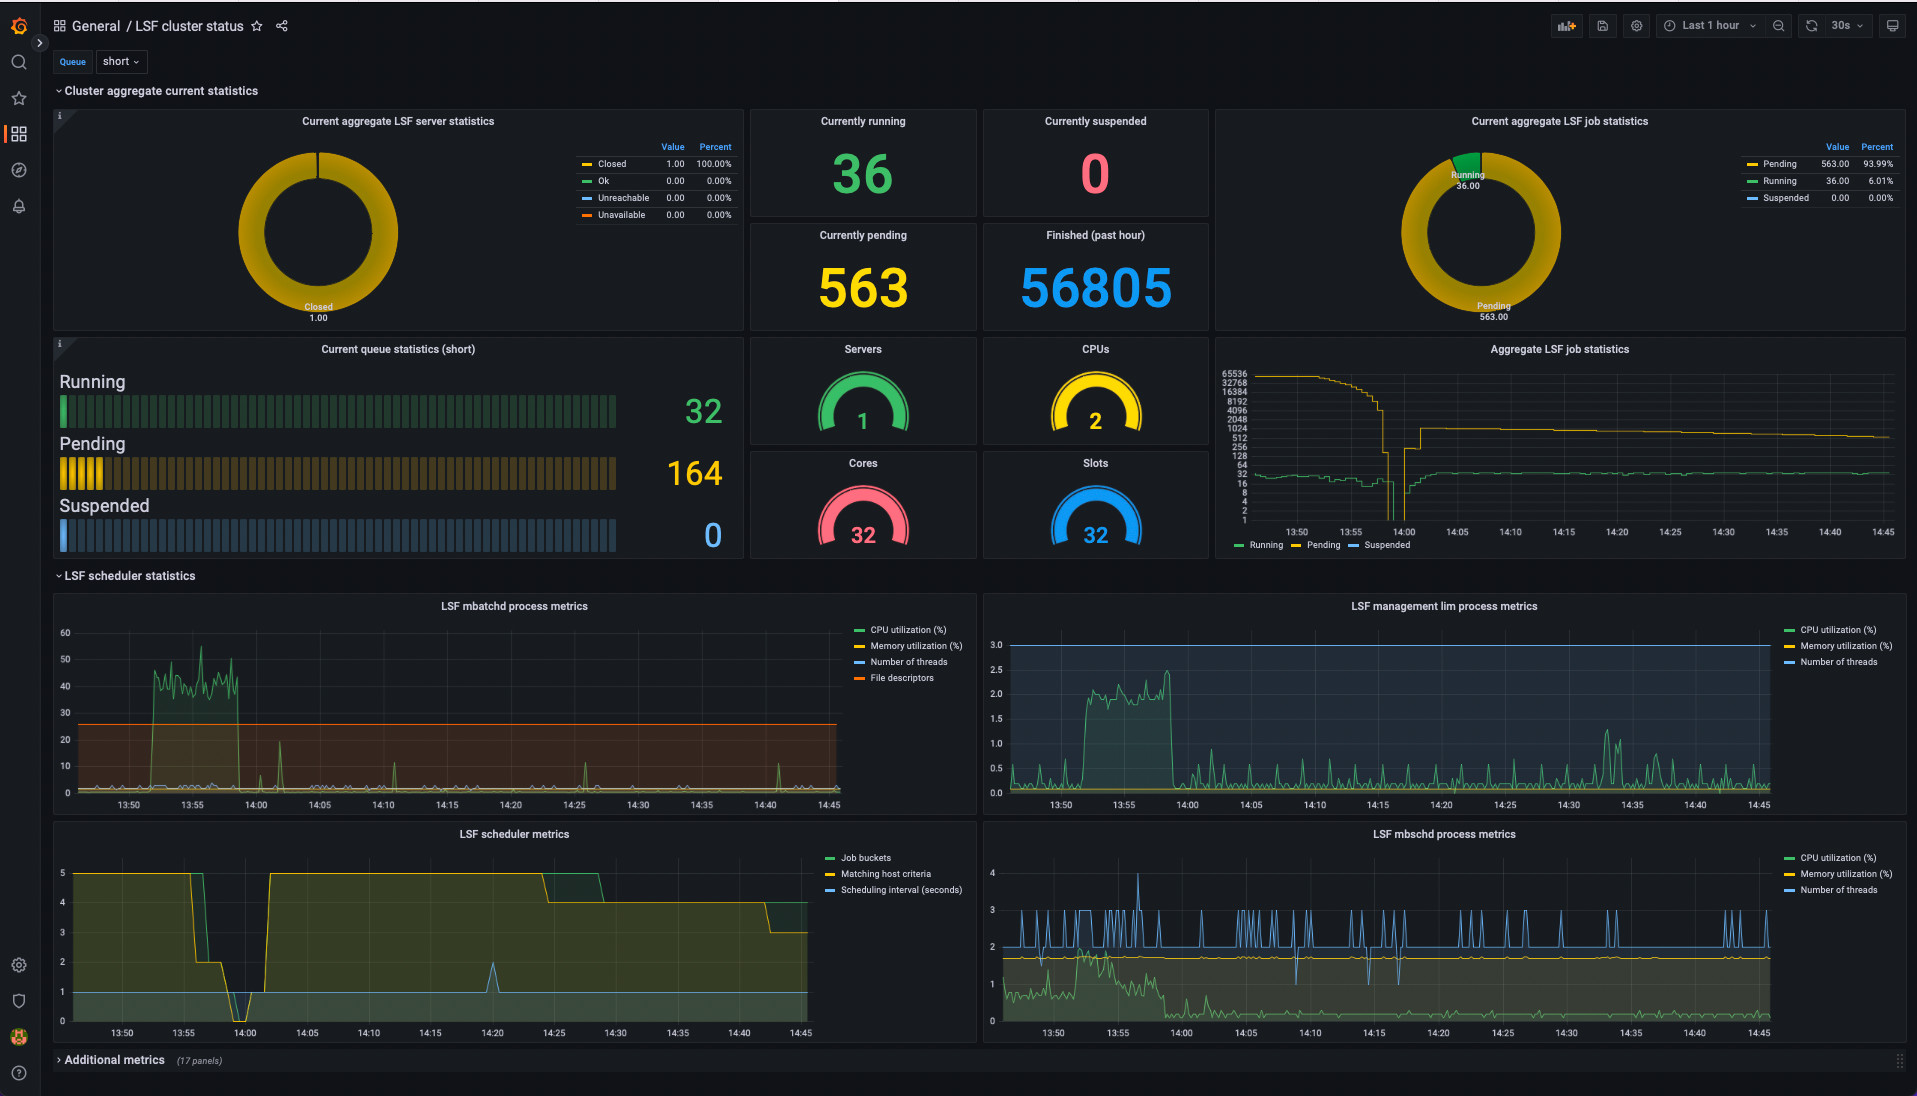
- With the datasource configured in Grafana, the final step is to create a dashboard. Creating a dashboard requires creating panels which display data pulled from the configured data source using targeted queries. With a bit of effort, I was able to piece together the following dashboard which includes both metrics from LSF, as well as metrics from Telegraf input.procstat for the LSF processes mbatchd, mbschd and the management lim.
Example dashboard definition (JSON). Click to expand!
{
"annotations": {
"list": [
{
"builtIn": 1,
"datasource": {
"type": "datasource",
"uid": "grafana"
},
"enable": true,
"hide": true,
"iconColor": "rgba(0, 211, 255, 1)",
"name": "Annotations & Alerts",
"target": {
"limit": 100,
"matchAny": false,
"tags": [],
"type": "dashboard"
},
"type": "dashboard"
}
]
},
"editable": true,
"fiscalYearStartMonth": 0,
"graphTooltip": 0,
"id": 21,
"links": [],
"liveNow": false,
"panels": [
{
"collapsed": false,
"gridPos": {
"h": 1,
"w": 24,
"x": 0,
"y": 0
},
"id": 35,
"panels": [],
"title": "Cluster aggregate current statistics",
"type": "row"
},
{
"datasource": {
"type": "influxdb",
"uid": "eNfWCy5Vk"
},
"description": "A view of the current status of the LSF servers in the cluster. Servers can be in one of four states: Ok, Unavailable, Closed and Unreachable. ",
"fieldConfig": {
"defaults": {
"color": {
"mode": "palette-classic"
},
"custom": {
"hideFrom": {
"legend": false,
"tooltip": false,
"viz": false
}
},
"decimals": 2,
"mappings": []
},
"overrides": []
},
"gridPos": {
"h": 8,
"w": 9,
"x": 0,
"y": 1
},
"id": 32,
"options": {
"displayLabels": [
"name",
"value"
],
"legend": {
"displayMode": "table",
"placement": "right",
"showLegend": true,
"sortBy": "Value",
"sortDesc": true,
"values": [
"value",
"percent"
]
},
"pieType": "donut",
"reduceOptions": {
"calcs": [
"lastNotNull"
],
"fields": "",
"values": false
},
"tooltip": {
"mode": "multi",
"sort": "none"
}
},
"targets": [
{
"alias": "Ok",
"datasource": {
"type": "influxdb",
"uid": "eNfWCy5Vk"
},
"groupBy": [
{
"params": [
"$__interval"
],
"type": "time"
},
{
"params": [
"null"
],
"type": "fill"
}
],
"hide": false,
"measurement": "lsf_servers",
"orderByTime": "ASC",
"policy": "autogen",
"refId": "A",
"resultFormat": "time_series",
"select": [
[
{
"params": [
"value"
],
"type": "field"
},
{
"params": [],
"type": "last"
}
]
],
"tags": [
{
"key": "status",
"operator": "=",
"value": "ok"
}
]
},
{
"alias": "Closed",
"datasource": {
"type": "influxdb",
"uid": "eNfWCy5Vk"
},
"groupBy": [
{
"params": [
"$__interval"
],
"type": "time"
},
{
"params": [
"null"
],
"type": "fill"
}
],
"hide": false,
"measurement": "lsf_servers",
"orderByTime": "ASC",
"policy": "autogen",
"refId": "B",
"resultFormat": "time_series",
"select": [
[
{
"params": [
"value"
],
"type": "field"
},
{
"params": [],
"type": "last"
}
]
],
"tags": [
{
"key": "status",
"operator": "=",
"value": "closed"
}
]
},
{
"alias": "Unreachable",
"datasource": {
"type": "influxdb",
"uid": "eNfWCy5Vk"
},
"groupBy": [
{
"params": [
"$__interval"
],
"type": "time"
},
{
"params": [
"null"
],
"type": "fill"
}
],
"hide": false,
"measurement": "lsf_servers",
"orderByTime": "ASC",
"policy": "default",
"refId": "C",
"resultFormat": "time_series",
"select": [
[
{
"params": [
"value"
],
"type": "field"
},
{
"params": [],
"type": "last"
}
]
],
"tags": [
{
"key": "status",
"operator": "=",
"value": "unreachable"
}
]
},
{
"alias": "Unavailable",
"datasource": {
"type": "influxdb",
"uid": "eNfWCy5Vk"
},
"groupBy": [
{
"params": [
"$__interval"
],
"type": "time"
},
{
"params": [
"null"
],
"type": "fill"
}
],
"hide": false,
"measurement": "lsf_servers",
"orderByTime": "ASC",
"policy": "autogen",
"refId": "D",
"resultFormat": "time_series",
"select": [
[
{
"params": [
"value"
],
"type": "field"
},
{
"params": [],
"type": "mean"
}
]
],
"tags": [
{
"key": "status",
"operator": "=",
"value": "unavailable"
}
]
}
],
"title": "Current aggregate LSF server statistics",
"type": "piechart"
},
{
"datasource": {
"type": "influxdb",
"uid": "eNfWCy5Vk"
},
"description": "",
"fieldConfig": {
"defaults": {
"color": {
"mode": "thresholds"
},
"mappings": [],
"thresholds": {
"mode": "absolute",
"steps": [
{
"color": "green",
"value": null
}
]
}
},
"overrides": []
},
"gridPos": {
"h": 4,
"w": 3,
"x": 9,
"y": 1
},
"id": 43,
"options": {
"colorMode": "value",
"graphMode": "none",
"justifyMode": "auto",
"orientation": "auto",
"reduceOptions": {
"calcs": [
"lastNotNull"
],
"fields": "",
"values": false
},
"text": {},
"textMode": "auto"
},
"pluginVersion": "9.1.6",
"targets": [
{
"datasource": {
"type": "influxdb",
"uid": "eNfWCy5Vk"
},
"groupBy": [
{
"params": [
"$__interval"
],
"type": "time"
},
{
"params": [
"null"
],
"type": "fill"
}
],
"hide": false,
"measurement": "lsf_jobs",
"orderByTime": "ASC",
"policy": "autogen",
"refId": "A",
"resultFormat": "time_series",
"select": [
[
{
"params": [
"value"
],
"type": "field"
},
{
"params": [],
"type": "distinct"
}
]
],
"tags": [
{
"key": "state",
"operator": "=",
"value": "running"
}
]
}
],
"title": "Currently running",
"type": "stat"
},
{
"datasource": {
"type": "influxdb",
"uid": "eNfWCy5Vk"
},
"description": "",
"fieldConfig": {
"defaults": {
"color": {
"mode": "thresholds"
},
"mappings": [],
"thresholds": {
"mode": "absolute",
"steps": [
{
"color": "light-red",
"value": null
}
]
}
},
"overrides": []
},
"gridPos": {
"h": 4,
"w": 3,
"x": 12,
"y": 1
},
"id": 45,
"options": {
"colorMode": "value",
"graphMode": "none",
"justifyMode": "auto",
"orientation": "auto",
"reduceOptions": {
"calcs": [
"lastNotNull"
],
"fields": "",
"values": false
},
"text": {},
"textMode": "auto"
},
"pluginVersion": "9.1.6",
"targets": [
{
"datasource": {
"type": "influxdb",
"uid": "eNfWCy5Vk"
},
"groupBy": [
{
"params": [
"$__interval"
],
"type": "time"
},
{
"params": [
"null"
],
"type": "fill"
}
],
"measurement": "lsf_jobs",
"orderByTime": "ASC",
"policy": "default",
"refId": "A",
"resultFormat": "time_series",
"select": [
[
{
"params": [
"value"
],
"type": "field"
},
{
"params": [],
"type": "mean"
}
]
],
"tags": [
{
"key": "state",
"operator": "=",
"value": "suspended"
}
]
}
],
"title": "Currently suspended",
"type": "stat"
},
{
"datasource": {
"type": "influxdb",
"uid": "eNfWCy5Vk"
},
"description": "",
"fieldConfig": {
"defaults": {
"color": {
"mode": "palette-classic"
},
"custom": {
"hideFrom": {
"legend": false,
"tooltip": false,
"viz": false
}
},
"decimals": 2,
"mappings": []
},
"overrides": []
},
"gridPos": {
"h": 8,
"w": 9,
"x": 15,
"y": 1
},
"id": 33,
"options": {
"displayLabels": [
"name",
"value"
],
"legend": {
"displayMode": "table",
"placement": "right",
"showLegend": true,
"sortBy": "Value",
"sortDesc": true,
"values": [
"value",
"percent"
]
},
"pieType": "donut",
"reduceOptions": {
"calcs": [
"lastNotNull"
],
"fields": "",
"values": false
},
"tooltip": {
"mode": "multi",
"sort": "none"
}
},
"targets": [
{
"alias": "Running",
"datasource": {
"type": "influxdb",
"uid": "eNfWCy5Vk"
},
"groupBy": [
{
"params": [
"$__interval"
],
"type": "time"
},
{
"params": [
"null"
],
"type": "fill"
}
],
"hide": false,
"measurement": "lsf_jobs",
"orderByTime": "ASC",
"policy": "autogen",
"refId": "A",
"resultFormat": "time_series",
"select": [
[
{
"params": [
"value"
],
"type": "field"
},
{
"params": [],
"type": "last"
}
]
],
"tags": [
{
"key": "state",
"operator": "=",
"value": "running"
}
]
},
{
"alias": "Pending",
"datasource": {
"type": "influxdb",
"uid": "eNfWCy5Vk"
},
"groupBy": [
{
"params": [
"$__interval"
],
"type": "time"
},
{
"params": [
"null"
],
"type": "fill"
}
],
"hide": false,
"measurement": "lsf_jobs",
"orderByTime": "ASC",
"policy": "autogen",
"refId": "B",
"resultFormat": "time_series",
"select": [
[
{
"params": [
"value"
],
"type": "field"
},
{
"params": [],
"type": "last"
}
]
],
"tags": [
{
"key": "state",
"operator": "=",
"value": "pending"
}
]
},
{
"alias": "Suspended",
"datasource": {
"type": "influxdb",
"uid": "eNfWCy5Vk"
},
"groupBy": [
{
"params": [
"$__interval"
],
"type": "time"
},
{
"params": [
"null"
],
"type": "fill"
}
],
"hide": false,
"measurement": "lsf_jobs",
"orderByTime": "ASC",
"policy": "autogen",
"refId": "C",
"resultFormat": "time_series",
"select": [
[
{
"params": [
"value"
],
"type": "field"
},
{
"params": [],
"type": "last"
}
]
],
"tags": [
{
"key": "state",
"operator": "=",
"value": "suspended"
}
]
}
],
"title": "Current aggregate LSF job statistics",
"type": "piechart"
},
{
"datasource": {
"type": "influxdb",
"uid": "eNfWCy5Vk"
},
"description": "",
"fieldConfig": {
"defaults": {
"color": {
"mode": "thresholds"
},
"mappings": [],
"thresholds": {
"mode": "absolute",
"steps": [
{
"color": "yellow",
"value": null
}
]
}
},
"overrides": []
},
"gridPos": {
"h": 4,
"w": 3,
"x": 9,
"y": 5
},
"id": 44,
"options": {
"colorMode": "value",
"graphMode": "none",
"justifyMode": "auto",
"orientation": "auto",
"reduceOptions": {
"calcs": [
"lastNotNull"
],
"fields": "",
"values": false
},
"text": {},
"textMode": "auto"
},
"pluginVersion": "9.1.6",
"targets": [
{
"datasource": {
"type": "influxdb",
"uid": "eNfWCy5Vk"
},
"groupBy": [
{
"params": [
"$__interval"
],
"type": "time"
},
{
"params": [
"null"
],
"type": "fill"
}
],
"measurement": "lsf_jobs",
"orderByTime": "ASC",
"policy": "default",
"refId": "A",
"resultFormat": "time_series",
"select": [
[
{
"params": [
"value"
],
"type": "field"
},
{
"params": [],
"type": "mean"
}
]
],
"tags": [
{
"key": "state",
"operator": "=",
"value": "pending"
}
]
}
],
"title": "Currently pending ",
"type": "stat"
},
{
"datasource": {
"type": "influxdb",
"uid": "eNfWCy5Vk"
},
"description": "",
"fieldConfig": {
"defaults": {
"color": {
"mode": "thresholds"
},
"mappings": [],
"thresholds": {
"mode": "absolute",
"steps": [
{
"color": "blue",
"value": null
}
]
}
},
"overrides": []
},
"gridPos": {
"h": 4,
"w": 3,
"x": 12,
"y": 5
},
"id": 46,
"options": {
"colorMode": "value",
"graphMode": "none",
"justifyMode": "auto",
"orientation": "auto",
"reduceOptions": {
"calcs": [
"lastNotNull"
],
"fields": "",
"values": false
},
"text": {},
"textMode": "auto"
},
"pluginVersion": "9.1.6",
"targets": [
{
"datasource": {
"type": "influxdb",
"uid": "eNfWCy5Vk"
},
"groupBy": [
{
"params": [
"$__interval"
],
"type": "time"
},
{
"params": [
"null"
],
"type": "fill"
}
],
"measurement": "lsf_jobs",
"orderByTime": "ASC",
"policy": "default",
"refId": "A",
"resultFormat": "time_series",
"select": [
[
{
"params": [
"value"
],
"type": "field"
},
{
"params": [],
"type": "mean"
}
]
],
"tags": [
{
"key": "state",
"operator": "=",
"value": "finished"
}
]
}
],
"title": "Finished (past hour)",
"type": "stat"
},
{
"datasource": {
"type": "influxdb",
"uid": "eNfWCy5Vk"
},
"description": "Spectrum LSF queue statistics. Here we show jobs in running, pending and suspended jobs. ",
"fieldConfig": {
"defaults": {
"color": {
"mode": "palette-classic"
},
"mappings": [],
"thresholds": {
"mode": "absolute",
"steps": [
{
"color": "green",
"value": null
},
{
"color": "red",
"value": 80
}
]
}
},
"overrides": []
},
"gridPos": {
"h": 8,
"w": 9,
"x": 0,
"y": 9
},
"id": 41,
"options": {
"displayMode": "lcd",
"minVizHeight": 10,
"minVizWidth": 0,
"orientation": "horizontal",
"reduceOptions": {
"calcs": [
"lastNotNull"
],
"fields": "",
"values": false
},
"showUnfilled": true
},
"pluginVersion": "9.1.6",
"targets": [
{
"alias": "Running",
"datasource": {
"type": "influxdb",
"uid": "eNfWCy5Vk"
},
"groupBy": [
{
"params": [
"$__interval"
],
"type": "time"
},
{
"params": [
"null"
],
"type": "fill"
}
],
"measurement": "lsf_queues",
"orderByTime": "ASC",
"policy": "autogen",
"refId": "A",
"resultFormat": "time_series",
"select": [
[
{
"params": [
"run"
],
"type": "field"
},
{
"params": [],
"type": "last"
}
]
],
"tags": [
{
"key": "name",
"operator": "=~",
"value": "/^$Queue$/"
}
]
},
{
"alias": "Pending",
"datasource": {
"type": "influxdb",
"uid": "eNfWCy5Vk"
},
"groupBy": [
{
"params": [
"$__interval"
],
"type": "time"
},
{
"params": [
"null"
],
"type": "fill"
}
],
"hide": false,
"measurement": "lsf_queues",
"orderByTime": "ASC",
"policy": "autogen",
"refId": "B",
"resultFormat": "time_series",
"select": [
[
{
"params": [
"pend"
],
"type": "field"
},
{
"params": [],
"type": "last"
}
]
],
"tags": [
{
"key": "name",
"operator": "=~",
"value": "/^$Queue$/"
}
]
},
{
"alias": "Suspended",
"datasource": {
"type": "influxdb",
"uid": "eNfWCy5Vk"
},
"groupBy": [
{
"params": [
"$__interval"
],
"type": "time"
},
{
"params": [
"null"
],
"type": "fill"
}
],
"hide": false,
"measurement": "lsf_queues",
"orderByTime": "ASC",
"policy": "autogen",
"refId": "C",
"resultFormat": "time_series",
"select": [
[
{
"params": [
"susp"
],
"type": "field"
},
{
"params": [],
"type": "last"
}
]
],
"tags": [
{
"key": "name",
"operator": "=~",
"value": "/^$Queue$/"
}
]
}
],
"title": "Current queue statistics ($Queue)",
"type": "bargauge"
},
{
"datasource": {
"type": "influxdb",
"uid": "eNfWCy5Vk"
},
"description": "",
"fieldConfig": {
"defaults": {
"color": {
"mode": "thresholds"
},
"mappings": [],
"min": 0,
"thresholds": {
"mode": "percentage",
"steps": [
{
"color": "green",
"value": null
}
]
},
"unit": "none"
},
"overrides": []
},
"gridPos": {
"h": 4,
"w": 3,
"x": 9,
"y": 9
},
"id": 53,
"options": {
"orientation": "auto",
"reduceOptions": {
"calcs": [
"lastNotNull"
],
"fields": "/^lsf_hosts\\.last$/",
"values": false
},
"showThresholdLabels": false,
"showThresholdMarkers": true
},
"pluginVersion": "9.1.6",
"targets": [
{
"datasource": {
"type": "influxdb",
"uid": "eNfWCy5Vk"
},
"groupBy": [
{
"params": [
"$__interval"
],
"type": "time"
},
{
"params": [
"null"
],
"type": "fill"
}
],
"hide": false,
"measurement": "lsf_hosts",
"orderByTime": "ASC",
"policy": "autogen",
"refId": "A",
"resultFormat": "time_series",
"select": [
[
{
"params": [
"current"
],
"type": "field"
},
{
"params": [],
"type": "last"
}
],
[
{
"params": [
"peak"
],
"type": "field"
}
]
],
"tags": [
{
"key": "host",
"operator": "=",
"value": "kilenc"
},
{
"condition": "AND",
"key": "state",
"operator": "=",
"value": "servers"
}
]
}
],
"title": "Servers",
"type": "gauge"
},
{
"datasource": {
"type": "influxdb",
"uid": "eNfWCy5Vk"
},
"description": "",
"fieldConfig": {
"defaults": {
"color": {
"mode": "thresholds"
},
"mappings": [],
"min": 0,
"thresholds": {
"mode": "percentage",
"steps": [
{
"color": "yellow",
"value": null
}
]
},
"unit": "none"
},
"overrides": []
},
"gridPos": {
"h": 4,
"w": 3,
"x": 12,
"y": 9
},
"id": 54,
"options": {
"orientation": "auto",
"reduceOptions": {
"calcs": [
"lastNotNull"
],
"fields": "/^lsf_hosts\\.last$/",
"values": false
},
"showThresholdLabels": false,
"showThresholdMarkers": true
},
"pluginVersion": "9.1.6",
"targets": [
{
"datasource": {
"type": "influxdb",
"uid": "eNfWCy5Vk"
},
"groupBy": [
{
"params": [
"$__interval"
],
"type": "time"
},
{
"params": [
"null"
],
"type": "fill"
}
],
"hide": false,
"measurement": "lsf_hosts",
"orderByTime": "ASC",
"policy": "autogen",
"refId": "A",
"resultFormat": "time_series",
"select": [
[
{
"params": [
"current"
],
"type": "field"
},
{
"params": [],
"type": "last"
}
],
[
{
"params": [
"peak"
],
"type": "field"
}
]
],
"tags": [
{
"key": "host",
"operator": "=",
"value": "kilenc"
},
{
"condition": "AND",
"key": "state",
"operator": "=",
"value": "cpus"
}
]
}
],
"title": "CPUs",
"type": "gauge"
},
{
"datasource": {
"type": "influxdb",
"uid": "eNfWCy5Vk"
},
"description": "",
"fieldConfig": {
"defaults": {
"color": {
"mode": "palette-classic"
},
"custom": {
"axisCenteredZero": false,
"axisColorMode": "text",
"axisLabel": "",
"axisPlacement": "auto",
"barAlignment": 0,
"drawStyle": "line",
"fillOpacity": 0,
"gradientMode": "none",
"hideFrom": {
"legend": false,
"tooltip": false,
"viz": false
},
"lineInterpolation": "stepBefore",
"lineWidth": 1,
"pointSize": 5,
"scaleDistribution": {
"log": 2,
"type": "log"
},
"showPoints": "auto",
"spanNulls": true,
"stacking": {
"group": "A",
"mode": "none"
},
"thresholdsStyle": {
"mode": "off"
}
},
"mappings": [],
"thresholds": {
"mode": "absolute",
"steps": [
{
"color": "green",
"value": null
},
{
"color": "red",
"value": 80
}
]
}
},
"overrides": []
},
"gridPos": {
"h": 8,
"w": 9,
"x": 15,
"y": 9
},
"id": 42,
"options": {
"legend": {
"calcs": [],
"displayMode": "list",
"placement": "bottom",
"showLegend": true
},
"tooltip": {
"mode": "single",
"sort": "none"
}
},
"targets": [
{
"alias": "Running",
"datasource": {
"type": "influxdb",
"uid": "eNfWCy5Vk"
},
"groupBy": [
{
"params": [
"$__interval"
],
"type": "time"
},
{
"params": [
"null"
],
"type": "fill"
}
],
"hide": false,
"measurement": "lsf_jobs",
"orderByTime": "ASC",
"policy": "autogen",
"refId": "A",
"resultFormat": "time_series",
"select": [
[
{
"params": [
"value"
],
"type": "field"
},
{
"params": [],
"type": "last"
}
]
],
"tags": [
{
"key": "state",
"operator": "=",
"value": "running"
}
]
},
{
"alias": "Pending",
"datasource": {
"type": "influxdb",
"uid": "eNfWCy5Vk"
},
"groupBy": [
{
"params": [
"$__interval"
],
"type": "time"
},
{
"params": [
"null"
],
"type": "fill"
}
],
"hide": false,
"measurement": "lsf_jobs",
"orderByTime": "ASC",
"policy": "autogen",
"refId": "B",
"resultFormat": "time_series",
"select": [
[
{
"params": [
"value"
],
"type": "field"
},
{
"params": [],
"type": "last"
}
]
],
"tags": [
{
"key": "state",
"operator": "=",
"value": "pending"
}
]
},
{
"alias": "Suspended",
"datasource": {
"type": "influxdb",
"uid": "eNfWCy5Vk"
},
"groupBy": [
{
"params": [
"$__interval"
],
"type": "time"
},
{
"params": [
"null"
],
"type": "fill"
}
],
"hide": false,
"measurement": "lsf_jobs",
"orderByTime": "ASC",
"policy": "autogen",
"refId": "C",
"resultFormat": "time_series",
"select": [
[
{
"params": [
"value"
],
"type": "field"
},
{
"params": [],
"type": "last"
}
]
],
"tags": [
{
"key": "state",
"operator": "=",
"value": "suspended"
}
]
}
],
"title": "Aggregate LSF job statistics",
"type": "timeseries"
},
{
"datasource": {
"type": "influxdb",
"uid": "eNfWCy5Vk"
},
"description": "",
"fieldConfig": {
"defaults": {
"color": {
"mode": "thresholds"
},
"mappings": [],
"min": 0,
"thresholds": {
"mode": "percentage",
"steps": [
{
"color": "light-red",
"value": null
}
]
},
"unit": "none"
},
"overrides": []
},
"gridPos": {
"h": 4,
"w": 3,
"x": 9,
"y": 13
},
"id": 55,
"options": {
"orientation": "auto",
"reduceOptions": {
"calcs": [
"lastNotNull"
],
"fields": "/^lsf_hosts\\.last$/",
"values": false
},
"showThresholdLabels": false,
"showThresholdMarkers": true
},
"pluginVersion": "9.1.6",
"targets": [
{
"datasource": {
"type": "influxdb",
"uid": "eNfWCy5Vk"
},
"groupBy": [
{
"params": [
"$__interval"
],
"type": "time"
},
{
"params": [
"null"
],
"type": "fill"
}
],
"hide": false,
"measurement": "lsf_hosts",
"orderByTime": "ASC",
"policy": "autogen",
"refId": "A",
"resultFormat": "time_series",
"select": [
[
{
"params": [
"current"
],
"type": "field"
},
{
"params": [],
"type": "last"
}
],
[
{
"params": [
"peak"
],
"type": "field"
}
]
],
"tags": [
{
"key": "host",
"operator": "=",
"value": "kilenc"
},
{
"condition": "AND",
"key": "state",
"operator": "=",
"value": "cores"
}
]
}
],
"title": "Cores",
"type": "gauge"
},
{
"datasource": {
"type": "influxdb",
"uid": "eNfWCy5Vk"
},
"description": "",
"fieldConfig": {
"defaults": {
"color": {
"mode": "thresholds"
},
"mappings": [],
"min": 0,
"thresholds": {
"mode": "percentage",
"steps": [
{
"color": "blue",
"value": null
}
]
},
"unit": "none"
},
"overrides": []
},
"gridPos": {
"h": 4,
"w": 3,
"x": 12,
"y": 13
},
"id": 56,
"options": {
"orientation": "auto",
"reduceOptions": {
"calcs": [
"lastNotNull"
],
"fields": "/^lsf_hosts\\.last$/",
"values": false
},
"showThresholdLabels": false,
"showThresholdMarkers": true
},
"pluginVersion": "9.1.6",
"targets": [
{
"datasource": {
"type": "influxdb",
"uid": "eNfWCy5Vk"
},
"groupBy": [
{
"params": [
"$__interval"
],
"type": "time"
},
{
"params": [
"null"
],
"type": "fill"
}
],
"hide": false,
"measurement": "lsf_hosts",
"orderByTime": "ASC",
"policy": "autogen",
"refId": "A",
"resultFormat": "time_series",
"select": [
[
{
"params": [
"current"
],
"type": "field"
},
{
"params": [],
"type": "last"
}
],
[
{
"params": [
"peak"
],
"type": "field"
}
]
],
"tags": [
{
"key": "host",
"operator": "=",
"value": "kilenc"
},
{
"condition": "AND",
"key": "state",
"operator": "=",
"value": "slots"
}
]
}
],
"title": "Slots",
"type": "gauge"
},
{
"collapsed": false,
"gridPos": {
"h": 1,
"w": 24,
"x": 0,
"y": 17
},
"id": 37,
"panels": [],
"title": "LSF scheduler statistics",
"type": "row"
},
{
"datasource": {
"type": "influxdb",
"uid": "eNfWCy5Vk"
},
"description": "",
"fieldConfig": {
"defaults": {
"color": {
"mode": "palette-classic"
},
"custom": {
"axisCenteredZero": false,
"axisColorMode": "text",
"axisLabel": "",
"axisPlacement": "auto",
"barAlignment": 0,
"drawStyle": "line",
"fillOpacity": 10,
"gradientMode": "none",
"hideFrom": {
"graph": false,
"legend": false,
"tooltip": false,
"viz": false
},
"lineInterpolation": "linear",
"lineWidth": 1,
"pointSize": 5,
"scaleDistribution": {
"type": "linear"
},
"showPoints": "never",
"spanNulls": true,
"stacking": {
"group": "A",
"mode": "none"
},
"thresholdsStyle": {
"mode": "off"
}
},
"mappings": [],
"thresholds": {
"mode": "absolute",
"steps": [
{
"color": "green",
"value": null
},
{
"color": "red",
"value": 80
}
]
},
"unit": "short"
},
"overrides": []
},
"gridPos": {
"h": 8,
"w": 12,
"x": 0,
"y": 18
},
"id": 20,
"options": {
"graph": {},
"legend": {
"calcs": [],
"displayMode": "list",
"placement": "right",
"showLegend": true
},
"tooltip": {
"mode": "single",
"sort": "none"
}
},
"pluginVersion": "7.5.15",
"targets": [
{
"alias": "CPU utilization (%)",
"datasource": {
"type": "influxdb",
"uid": "eNfWCy5Vk"
},
"groupBy": [
{
"params": [
"$__interval"
],
"type": "time"
},
{
"params": [
"null"
],
"type": "fill"
}
],
"measurement": "procstat",
"orderByTime": "ASC",
"policy": "autogen",
"refId": "A",
"resultFormat": "time_series",
"select": [
[
{
"params": [
"cpu_usage"
],
"type": "field"
},
{
"params": [],
"type": "mean"
}
]
],
"tags": [
{
"key": "exe",
"operator": "=",
"value": "mbatchd"
},
{
"condition": "AND",
"key": "host",
"operator": "=",
"value": "kilenc"
}
]
},
{
"alias": "Memory utilization (%)",
"datasource": {
"type": "influxdb",
"uid": "eNfWCy5Vk"
},
"groupBy": [
{
"params": [
"$__interval"
],
"type": "time"
},
{
"params": [
"null"
],
"type": "fill"
}
],
"hide": false,
"measurement": "procstat",
"orderByTime": "ASC",
"policy": "autogen",
"refId": "B",
"resultFormat": "time_series",
"select": [
[
{
"params": [
"memory_usage"
],
"type": "field"
},
{
"params": [],
"type": "mean"
}
]
],
"tags": [
{
"key": "exe",
"operator": "=",
"value": "mbatchd"
},
{
"condition": "AND",
"key": "host",
"operator": "=",
"value": "kilenc"
}
]
},
{
"alias": "Number of threads",
"datasource": {
"type": "influxdb",
"uid": "eNfWCy5Vk"
},
"groupBy": [
{
"params": [
"$__interval"
],
"type": "time"
},
{
"params": [
"null"
],
"type": "fill"
}
],
"hide": false,
"measurement": "procstat",
"orderByTime": "ASC",
"policy": "autogen",
"refId": "C",
"resultFormat": "time_series",
"select": [
[
{
"params": [
"num_threads"
],
"type": "field"
},
{
"params": [],
"type": "mean"
}
]
],
"tags": [
{
"key": "exe",
"operator": "=",
"value": "mbatchd"
},
{
"condition": "AND",
"key": "host",
"operator": "=",
"value": "kilenc"
}
]
},
{
"alias": "File descriptors",
"datasource": {
"type": "influxdb",
"uid": "eNfWCy5Vk"
},
"groupBy": [
{
"params": [
"$__interval"
],
"type": "time"
},
{
"params": [
"null"
],
"type": "fill"
}
],
"hide": false,
"measurement": "lsf_mbatchd",
"orderByTime": "ASC",
"policy": "autogen",
"refId": "D",
"resultFormat": "time_series",
"select": [
[
{
"params": [
"value"
],
"type": "field"
},
{
"params": [],
"type": "mean"
}
]
],
"tags": [
{
"key": "fd",
"operator": "=",
"value": "used"
},
{
"condition": "AND",
"key": "host",
"operator": "=",
"value": "kilenc"
}
]
}
],
"title": "LSF mbatchd process metrics",
"type": "timeseries"
},
{
"datasource": {
"type": "influxdb",
"uid": "eNfWCy5Vk"
},
"description": "",
"fieldConfig": {
"defaults": {
"color": {
"mode": "palette-classic"
},
"custom": {
"axisCenteredZero": false,
"axisColorMode": "text",
"axisLabel": "",
"axisPlacement": "auto",
"barAlignment": 0,
"drawStyle": "line",
"fillOpacity": 10,
"gradientMode": "none",
"hideFrom": {
"graph": false,
"legend": false,
"tooltip": false,
"viz": false
},
"lineInterpolation": "linear",
"lineWidth": 1,
"pointSize": 5,
"scaleDistribution": {
"type": "linear"
},
"showPoints": "never",
"spanNulls": true,
"stacking": {
"group": "A",
"mode": "none"
},
"thresholdsStyle": {
"mode": "off"
}
},
"mappings": [],
"thresholds": {
"mode": "absolute",
"steps": [
{
"color": "green",
"value": null
},
{
"color": "red",
"value": 80
}
]
},
"unit": "short"
},
"overrides": []
},
"gridPos": {
"h": 8,
"w": 12,
"x": 12,
"y": 18
},
"id": 57,
"options": {
"graph": {},
"legend": {
"calcs": [],
"displayMode": "list",
"placement": "right",
"showLegend": true
},
"tooltip": {
"mode": "single",
"sort": "none"
}
},
"pluginVersion": "7.5.15",
"targets": [
{
"alias": "CPU utilization (%)",
"datasource": {
"type": "influxdb",
"uid": "eNfWCy5Vk"
},
"groupBy": [
{
"params": [
"$__interval"
],
"type": "time"
},
{
"params": [
"null"
],
"type": "fill"
}
],
"measurement": "procstat",
"orderByTime": "ASC",
"policy": "autogen",
"refId": "A",
"resultFormat": "time_series",
"select": [
[
{
"params": [
"cpu_usage"
],
"type": "field"
},
{
"params": [],
"type": "mean"
}
]
],
"tags": [
{
"key": "exe",
"operator": "=",
"value": "lim"
},
{
"condition": "AND",
"key": "host",
"operator": "=",
"value": "kilenc"
}
]
},
{
"alias": "Memory utilization (%)",
"datasource": {
"type": "influxdb",
"uid": "eNfWCy5Vk"
},
"groupBy": [
{
"params": [
"$__interval"
],
"type": "time"
},
{
"params": [
"null"
],
"type": "fill"
}
],
"hide": false,
"measurement": "procstat",
"orderByTime": "ASC",
"policy": "autogen",
"refId": "B",
"resultFormat": "time_series",
"select": [
[
{
"params": [
"memory_usage"
],
"type": "field"
},
{
"params": [],
"type": "mean"
}
]
],
"tags": [
{
"key": "exe",
"operator": "=",
"value": "lim"
},
{
"condition": "AND",
"key": "host",
"operator": "=",
"value": "kilenc"
}
]
},
{
"alias": "Number of threads",
"datasource": {
"type": "influxdb",
"uid": "eNfWCy5Vk"
},
"groupBy": [
{
"params": [
"$__interval"
],
"type": "time"
},
{
"params": [
"null"
],
"type": "fill"
}
],
"hide": false,
"measurement": "procstat",
"orderByTime": "ASC",
"policy": "autogen",
"refId": "C",
"resultFormat": "time_series",
"select": [
[
{
"params": [
"num_threads"
],
"type": "field"
},
{
"params": [],
"type": "mean"
}
]
],
"tags": [
{
"key": "exe",
"operator": "=",
"value": "lim"
},
{
"condition": "AND",
"key": "host",
"operator": "=",
"value": "kilenc"
}
]
}
],
"title": "LSF management lim process metrics",
"type": "timeseries"
},
{
"datasource": {
"type": "influxdb",
"uid": "eNfWCy5Vk"
},
"fieldConfig": {
"defaults": {
"color": {
"mode": "palette-classic"
},
"custom": {
"axisCenteredZero": false,
"axisColorMode": "text",
"axisLabel": "",
"axisPlacement": "auto",
"barAlignment": 0,
"drawStyle": "line",
"fillOpacity": 10,
"gradientMode": "none",
"hideFrom": {
"graph": false,
"legend": false,
"tooltip": false,
"viz": false
},
"lineInterpolation": "linear",
"lineWidth": 1,
"pointSize": 5,
"scaleDistribution": {
"type": "linear"
},
"showPoints": "never",
"spanNulls": true,
"stacking": {
"group": "A",
"mode": "none"
},
"thresholdsStyle": {
"mode": "off"
}
},
"mappings": [],
"thresholds": {
"mode": "absolute",
"steps": [
{
"color": "green"
},
{
"color": "red",
"value": 80
}
]
},
"unit": "short"
},
"overrides": []
},
"gridPos": {
"h": 8,
"w": 12,
"x": 0,
"y": 26
},
"id": 27,
"options": {
"graph": {},
"legend": {
"calcs": [],
"displayMode": "list",
"placement": "right",
"showLegend": true
},
"tooltip": {
"mode": "single",
"sort": "none"
}
},
"pluginVersion": "7.5.15",
"targets": [
{
"alias": "Job buckets",
"datasource": {
"type": "influxdb",
"uid": "eNfWCy5Vk"
},
"groupBy": [
{
"params": [
"$__interval"
],
"type": "time"
},
{
"params": [
"null"
],
"type": "fill"
}
],
"measurement": "lsf_mbatchd",
"orderByTime": "ASC",
"policy": "autogen",
"refId": "A",
"resultFormat": "time_series",
"select": [
[
{
"params": [
"value"
],
"type": "field"
},
{
"params": [],
"type": "mean"
}
]
],
"tags": [
{
"key": "sched",
"operator": "=",
"value": "buckets"
},
{
"condition": "AND",
"key": "host",
"operator": "=",
"value": "kilenc"
}
]
},
{
"alias": "Matching host criteria",
"datasource": {
"type": "influxdb",
"uid": "eNfWCy5Vk"
},
"groupBy": [
{
"params": [
"$__interval"
],
"type": "time"
},
{
"params": [
"null"
],
"type": "fill"
}
],
"hide": false,
"measurement": "lsf_mbatchd",
"orderByTime": "ASC",
"policy": "autogen",
"refId": "B",
"resultFormat": "time_series",
"select": [
[
{
"params": [
"value"
],
"type": "field"
},
{
"params": [],
"type": "mean"
}
]
],
"tags": [
{
"key": "sched",
"operator": "=",
"value": "matchhost"
},
{
"condition": "AND",
"key": "host",
"operator": "=",
"value": "kilenc"
}
]
},
{
"alias": "Scheduling interval (seconds)",
"datasource": {
"type": "influxdb",
"uid": "eNfWCy5Vk"
},
"groupBy": [
{
"params": [
"$__interval"
],
"type": "time"
},
{
"params": [
"null"
],
"type": "fill"
}
],
"hide": false,
"measurement": "lsf_mbatchd",
"orderByTime": "ASC",
"policy": "autogen",
"refId": "C",
"resultFormat": "time_series",
"select": [
[
{
"params": [
"value"
],
"type": "field"
},
{
"params": [],
"type": "mean"
}
]
],
"tags": [
{
"key": "sched",
"operator": "=",
"value": "interval"
},
{
"condition": "AND",
"key": "host",
"operator": "=",
"value": "kilenc"
}
]
}
],
"title": "LSF scheduler metrics",
"type": "timeseries"
},
{
"datasource": {
"type": "influxdb",
"uid": "eNfWCy5Vk"
},
"description": "",
"fieldConfig": {
"defaults": {
"color": {
"mode": "palette-classic"
},
"custom": {
"axisCenteredZero": false,
"axisColorMode": "text",
"axisLabel": "",
"axisPlacement": "auto",
"barAlignment": 0,
"drawStyle": "line",
"fillOpacity": 10,
"gradientMode": "none",
"hideFrom": {
"graph": false,
"legend": false,
"tooltip": false,
"viz": false
},
"lineInterpolation": "linear",
"lineWidth": 1,
"pointSize": 5,
"scaleDistribution": {
"type": "linear"
},
"showPoints": "never",
"spanNulls": true,
"stacking": {
"group": "A",
"mode": "none"
},
"thresholdsStyle": {
"mode": "off"
}
},
"mappings": [],
"thresholds": {
"mode": "absolute",
"steps": [
{
"color": "green"
},
{
"color": "red",
"value": 80
}
]
},
"unit": "short"
},
"overrides": []
},
"gridPos": {
"h": 8,
"w": 12,
"x": 12,
"y": 26
},
"id": 58,
"options": {
"graph": {},
"legend": {
"calcs": [],
"displayMode": "list",
"placement": "right",
"showLegend": true
},
"tooltip": {
"mode": "single",
"sort": "none"
}
},
"pluginVersion": "7.5.15",
"targets": [
{
"alias": "CPU utilization (%)",
"datasource": {
"type": "influxdb",
"uid": "eNfWCy5Vk"
},
"groupBy": [
{
"params": [
"$__interval"
],
"type": "time"
},
{
"params": [
"null"
],
"type": "fill"
}
],
"measurement": "procstat",
"orderByTime": "ASC",
"policy": "autogen",
"refId": "A",
"resultFormat": "time_series",
"select": [
[
{
"params": [
"cpu_usage"
],
"type": "field"
},
{
"params": [],
"type": "mean"
}
]
],
"tags": [
{
"key": "exe",
"operator": "=",
"value": "mbschd"
},
{
"condition": "AND",
"key": "host",
"operator": "=",
"value": "kilenc"
}
]
},
{
"alias": "Memory utilization (%)",
"datasource": {
"type": "influxdb",
"uid": "eNfWCy5Vk"
},
"groupBy": [
{
"params": [
"$__interval"
],
"type": "time"
},
{
"params": [
"null"
],
"type": "fill"
}
],
"hide": false,
"measurement": "procstat",
"orderByTime": "ASC",
"policy": "autogen",
"refId": "B",
"resultFormat": "time_series",
"select": [
[
{
"params": [
"memory_usage"
],
"type": "field"
},
{
"params": [],
"type": "mean"
}
]
],
"tags": [
{
"key": "exe",
"operator": "=",
"value": "mbatchd"
},
{
"condition": "AND",
"key": "host",
"operator": "=",
"value": "kilenc"
}
]
},
{
"alias": "Number of threads",
"datasource": {
"type": "influxdb",
"uid": "eNfWCy5Vk"
},
"groupBy": [
{
"params": [
"$__interval"
],
"type": "time"
},
{
"params": [
"null"
],
"type": "fill"
}
],
"hide": false,
"measurement": "procstat",
"orderByTime": "ASC",
"policy": "autogen",
"refId": "C",
"resultFormat": "time_series",
"select": [
[
{
"params": [
"num_threads"
],
"type": "field"
},
{
"params": [],
"type": "mean"
}
]
],
"tags": [
{
"key": "exe",
"operator": "=",
"value": "mbatchd"
},
{
"condition": "AND",
"key": "host",
"operator": "=",
"value": "kilenc"
}
]
}
],
"title": "LSF mbschd process metrics",
"type": "timeseries"
}
],
"refresh": "30s",
"schemaVersion": 37,
"style": "dark",
"tags": [],
"templating": {
"list": [
{
"current": {
"selected": true,
"text": [
"priority"
],
"value": [
"priority"
]
},
"datasource": {
"type": "influxdb",
"uid": "oSnSlVc4k"
},
"definition": "show tag values from \"lsf_queues\" with key=\"name\"",
"hide": 0,
"includeAll": false,
"multi": false,
"name": "Queue",
"options": [],
"query": "show tag values from \"lsf_queues\" with key=\"name\"",
"refresh": 1,
"regex": "",
"skipUrlSync": false,
"sort": 0,
"tagValuesQuery": "",
"tagsQuery": "",
"type": "query",
"useTags": false
}
]
},
"time": {
"from": "now-1h",
"to": "now"
},
"timepicker": {},
"timezone": "",
"title": "LSF dashboard",
"uid": "-tdhK5x4k",
"version": 2,
"weekStart": ""
}
As you can see, with a short plugin script to collect information from LSF, it’s possible to monitor your LSF cluster using the TIG stack. It’s important to note that there are powerful monitoring and reporting tools available from IBM as add-ons to LSF; IBM Spectrum LSF RTM and IBM Spectrum LSF Explorer. You can find more details about the add-on capabilities for LSF here.