
NUMA on POWER9

Non-uniform memory access (NUMA) systems are servers made up a single planar board (motherboard) with more than one CPU socket. On such servers, each CPU socket is directly connected to part of the system main memory but can also use parts of the main memory to which it is not directly connected via a crossbar or interconnect. Memory access times on NUMA systems are thus not uniform and depend upon the location of the memory from the CPU socket from which it is accessed. In other words, there is a performance penalty to accessing memory which is not local to a given CPU socket via the interconnect. Much has been written about NUMA from both a hardware and OS perspective.
From a performance perspective therefore, strategies such as memory affinity and CPU pinning are important considerations when running on NUMA systems. As this is an HPC focused blog, we’ll look at this through the lens of the well-known IBM Spectrum LSF workload scheduler. LSF supports Linux on ppc64le, aarch64 and x86-64. The test system in this case is a dual-socket IBM POWER9 based server configured as follows:
- CentOS Stream 8 (ppc64le)
- Dual socket POWER9
- 32GB main memory (2 x 16GB DIMMs)
- 1TB storage
- IBM Spectrum LSF Suite for HPC v10.2.0.11
- NVIDIA V100 GPU
Let’s begin by looking at how many NUMA zones are on this POWER9 based system. We can do this using the lscpu command.
# lscpu
Architecture:        ppc64le
Byte Order:          Little Endian
CPU(s):              128
On-line CPU(s) list: 0-127
Thread(s) per core:  4
Core(s) per socket:  16
Socket(s):           2
NUMA node(s):        2
Model:               2.1 (pvr 004e 1201)
Model name:          POWER9, altivec supported
CPU max MHz:         3800.0000
CPU min MHz:         1838.0000
L1d cache:           32K
L1i cache:           32K
L2 cache:            512K
L3 cache:            10240K
NUMA node0 CPU(s):   0-63
NUMA node8 CPU(s):   64-127
We see above that there are two NUMA nodes (0, 8), each with 64 threads. The system has a (meager) total of 32GB RAM - we confirm this using the free command.
# free
              total        used        free      shared  buff/cache   available
Mem:       32252096     7766080    21522880      130048     2963136    23240448
Swap:      16650176           0    16650176
In order to see how memory is attached to each NUMA node, we use the system numactl command as follows. We confirm that there is 16GB RAM per NUMA node. This also shows the distances (weights) between each NUMA node. As expected, this corresponds to how the 2 x 16 GB DIMMs are installed in the system – one for each respective CPU socket.
# numactl -H
available: 2 nodes (0,8)
node 0 cpus: 0 1 2 3 4 5 6 7 8 9 10 11 12 13 14 15 16 17 18 19 20 21 22 23 24 25 26 27 28 29 30 31 32 33 34 35 36 37 38 39 40 41 42 43 44 45 46 47 48 49 50 51 52 53 54 55 56 57 58 59 60 61 62 63
node 0 size: 15262 MB
node 0 free: 9424 MB
node 8 cpus: 64 65 66 67 68 69 70 71 72 73 74 75 76 77 78 79 80 81 82 83 84 85 86 87 88 89 90 91 92 93 94 95 96 97 98 99 100 101 102 103 104 105 106 107 108 109 110 111 112 113 114 115 116 117 118 119 120 121 122 123 124 125 126 127
node 8 size: 16233 MB
node 8 free: 11595 MB
node distances:
node   0   8
  0:  10  40
  8:  40  10
Above, we see the system has a total of 128 threads. This is with simultaneous multithreading (SMT) configured to 4. There is a total of 16 cores per socket, for a total of 32 cores in the system. With SMT set to 4, we get the value of 128 (32 cores * 4 threads).
Linux on PowerLE (Little Endian) includes the ppc64_cpu command which allows you to display characteristics and settings of CPUs including SMT (Simultaneous multithreading). The output from ppc64_cpu is provided below, showing cores 0 - 31, each with 4 threads. The * beside each thread denotes that it’s active.
# ppc64_cpu --info
Core   0:    0*    1*    2*    3*
Core   1:    4*    5*    6*    7*
Core   2:    8*    9*   10*   11*
Core   3:   12*   13*   14*   15*
Core   4:   16*   17*   18*   19*
Core   5:   20*   21*   22*   23*
Core   6:   24*   25*   26*   27*
Core   7:   28*   29*   30*   31*
Core   8:   32*   33*   34*   35*
Core   9:   36*   37*   38*   39*
Core  10:   40*   41*   42*   43*
Core  11:   44*   45*   46*   47*
Core  12:   48*   49*   50*   51*
Core  13:   52*   53*   54*   55*
Core  14:   56*   57*   58*   59*
Core  15:   60*   61*   62*   63*
Core  16:   64*   65*   66*   67*
Core  17:   68*   69*   70*   71*
Core  18:   72*   73*   74*   75*
Core  19:   76*   77*   78*   79*
Core  20:   80*   81*   82*   83*
Core  21:   84*   85*   86*   87*
Core  22:   88*   89*   90*   91*
Core  23:   92*   93*   94*   95*
Core  24:   96*   97*   98*   99*
Core  25:  100*  101*  102*  103*
Core  26:  104*  105*  106*  107*
Core  27:  108*  109*  110*  111*
Core  28:  112*  113*  114*  115*
Core  29:  116*  117*  118*  119*
Core  30:  120*  121*  122*  123*
Core  31:  124*  125*  126*  127*
The ppc64_cpu command makes it very easy to configure SMT on the fly. Here we turn off SMT.
# ppc64_cpu --smt=off

# ppc64_cpu --smt
SMT is off
Now when we run ppc64_cpu –info we see that SMT is disabled. Note that we only see one * per row now and the lscpu command shows the corresponding offline CPUs (threads).
# ppc64_cpu --info
Core   0:    0*    1     2     3
Core   1:    4*    5     6     7
Core   2:    8*    9    10    11
Core   3:   12*   13    14    15
Core   4:   16*   17    18    19
Core   5:   20*   21    22    23
Core   6:   24*   25    26    27
Core   7:   28*   29    30    31
Core   8:   32*   33    34    35
Core   9:   36*   37    38    39
Core  10:   40*   41    42    43
Core  11:   44*   45    46    47
Core  12:   48*   49    50    51
Core  13:   52*   53    54    55
Core  14:   56*   57    58    59
Core  15:   60*   61    62    63
Core  16:   64*   65    66    67
Core  17:   68*   69    70    71
Core  18:   72*   73    74    75
Core  19:   76*   77    78    79
Core  20:   80*   81    82    83
Core  21:   84*   85    86    87
Core  22:   88*   89    90    91
Core  23:   92*   93    94    95
Core  24:   96*   97    98    99
Core  25:  100*  101   102   103
Core  26:  104*  105   106   107
Core  27:  108*  109   110   111
Core  28:  112*  113   114   115
Core  29:  116*  117   118   119
Core  30:  120*  121   122   123
Core  31:  124*  125   126   127

# lscpu
Architecture:         ppc64le
Byte Order:           Little Endian
CPU(s):               128
On-line CPU(s) list:  0,4,8,12,16,20,24,28,32,36,40,44,48,52,56,60,64,68,72,76,80,84,88,92,96,100,104,108,112,116,120,124
Off-line CPU(s) list: 1-3,5-7,9-11,13-15,17-19,21-23,25-27,29-31,33-35,37-39,41-43,45-47,49-51,53-55,57-59,61-63,65-67,69-71,73-75,77-79,81-83,85-87,89-91,93-95,97-99,101-103,105-107,109-111,113-115,117-119,121-123,125-127
Thread(s) per core:   1
Core(s) per socket:   16
Socket(s):            2
NUMA node(s):         2
Model:                2.1 (pvr 004e 1201)
Model name:           POWER9, altivec supported
CPU max MHz:          3800.0000
CPU min MHz:          1838.0000
L1d cache:            32K
L1i cache:            32K
L2 cache:             512K
L3 cache:             10240K
NUMA node0 CPU(s):    0,4,8,12,16,20,24,28,32,36,40,44,48,52,56,60
NUMA node8 CPU(s):    64,68,72,76,80,84,88,92,96,100,104,108,112,116,120,124
We’ve explored a number of useful commands up to this point to display information about the NUMA nodes. Another command to note is lstopo, which is part of the portable hardware locality (hwloc) project. lstopo can display both in text and graphical format information about the system topology including NUMA node and PCIe devices. On CentOS 8 Stream, lstopo is part of the OS lstopo-gui package.
However, the OS lstopo binary is not compiled with NVIDIA CUDA support. As the system in question is equipped with an NVIDIA V100, I’ve recompiled lstopo based on the latest version of hwloc 2.7.0.
Both the text and graphical output from lstopo follow below.
# ./lstopo
Machine (31GB total)
  Package L#0
    NUMANode L#0 (P#0 15GB)
    L3 L#0 (10MB) + L2 L#0 (512KB)
      L1d L#0 (32KB) + L1i L#0 (32KB) + Core L#0 + PU L#0 (P#0)
      L1d L#1 (32KB) + L1i L#1 (32KB) + Core L#1 + PU L#1 (P#4)
    L3 L#1 (10MB) + L2 L#1 (512KB)
      L1d L#2 (32KB) + L1i L#2 (32KB) + Core L#2 + PU L#2 (P#8)
      L1d L#3 (32KB) + L1i L#3 (32KB) + Core L#3 + PU L#3 (P#12)
    L3 L#2 (10MB) + L2 L#2 (512KB)
      L1d L#4 (32KB) + L1i L#4 (32KB) + Core L#4 + PU L#4 (P#16)
      L1d L#5 (32KB) + L1i L#5 (32KB) + Core L#5 + PU L#5 (P#20)
    L3 L#3 (10MB) + L2 L#3 (512KB)
      L1d L#6 (32KB) + L1i L#6 (32KB) + Core L#6 + PU L#6 (P#24)
      L1d L#7 (32KB) + L1i L#7 (32KB) + Core L#7 + PU L#7 (P#28)
    L3 L#4 (10MB) + L2 L#4 (512KB)
      L1d L#8 (32KB) + L1i L#8 (32KB) + Core L#8 + PU L#8 (P#32)
      L1d L#9 (32KB) + L1i L#9 (32KB) + Core L#9 + PU L#9 (P#36)
    L3 L#5 (10MB) + L2 L#5 (512KB)
      L1d L#10 (32KB) + L1i L#10 (32KB) + Core L#10 + PU L#10 (P#40)
      L1d L#11 (32KB) + L1i L#11 (32KB) + Core L#11 + PU L#11 (P#44)
    L3 L#6 (10MB) + L2 L#6 (512KB)
      L1d L#12 (32KB) + L1i L#12 (32KB) + Core L#12 + PU L#12 (P#48)
      L1d L#13 (32KB) + L1i L#13 (32KB) + Core L#13 + PU L#13 (P#52)
    L3 L#7 (10MB) + L2 L#7 (512KB)
      L1d L#14 (32KB) + L1i L#14 (32KB) + Core L#14 + PU L#14 (P#56)
      L1d L#15 (32KB) + L1i L#15 (32KB) + Core L#15 + PU L#15 (P#60)
    HostBridge
      PCIBridge
        PCI 0002:01:00.0 (SAS)
          Block(Disk) "sdb"
          Block(Disk) "sda"
    HostBridge
      PCIBridge
        PCI 0004:01:00.0 (Ethernet)
          Net "enP4p1s0f0"
        PCI 0004:01:00.1 (Ethernet)
          Net "enP4p1s0f1"
    HostBridge
      PCIBridge
        PCIBridge
          PCI 0005:02:00.0 (VGA)
  Package L#1
    NUMANode L#1 (P#8 16GB)
    L3 L#8 (10MB) + L2 L#8 (512KB)
      L1d L#16 (32KB) + L1i L#16 (32KB) + Core L#16 + PU L#16 (P#64)
      L1d L#17 (32KB) + L1i L#17 (32KB) + Core L#17 + PU L#17 (P#68)
    L3 L#9 (10MB) + L2 L#9 (512KB)
      L1d L#18 (32KB) + L1i L#18 (32KB) + Core L#18 + PU L#18 (P#72)
      L1d L#19 (32KB) + L1i L#19 (32KB) + Core L#19 + PU L#19 (P#76)
    L3 L#10 (10MB) + L2 L#10 (512KB)
      L1d L#20 (32KB) + L1i L#20 (32KB) + Core L#20 + PU L#20 (P#80)
      L1d L#21 (32KB) + L1i L#21 (32KB) + Core L#21 + PU L#21 (P#84)
    L3 L#11 (10MB) + L2 L#11 (512KB)
      L1d L#22 (32KB) + L1i L#22 (32KB) + Core L#22 + PU L#22 (P#88)
      L1d L#23 (32KB) + L1i L#23 (32KB) + Core L#23 + PU L#23 (P#92)
    L3 L#12 (10MB) + L2 L#12 (512KB)
      L1d L#24 (32KB) + L1i L#24 (32KB) + Core L#24 + PU L#24 (P#96)
      L1d L#25 (32KB) + L1i L#25 (32KB) + Core L#25 + PU L#25 (P#100)
    L3 L#13 (10MB) + L2 L#13 (512KB)
      L1d L#26 (32KB) + L1i L#26 (32KB) + Core L#26 + PU L#26 (P#104)
      L1d L#27 (32KB) + L1i L#27 (32KB) + Core L#27 + PU L#27 (P#108)
    L3 L#14 (10MB) + L2 L#14 (512KB)
      L1d L#28 (32KB) + L1i L#28 (32KB) + Core L#28 + PU L#28 (P#112)
      L1d L#29 (32KB) + L1i L#29 (32KB) + Core L#29 + PU L#29 (P#116)
    L3 L#15 (10MB) + L2 L#15 (512KB)
      L1d L#30 (32KB) + L1i L#30 (32KB) + Core L#30 + PU L#30 (P#120)
      L1d L#31 (32KB) + L1i L#31 (32KB) + Core L#31 + PU L#31 (P#124)
    HostBridge
      PCIBridge
        PCI 0033:01:00.0 (3D)
          CoProc(CUDA) "cuda0"
          GPU(NVML) "nvml0"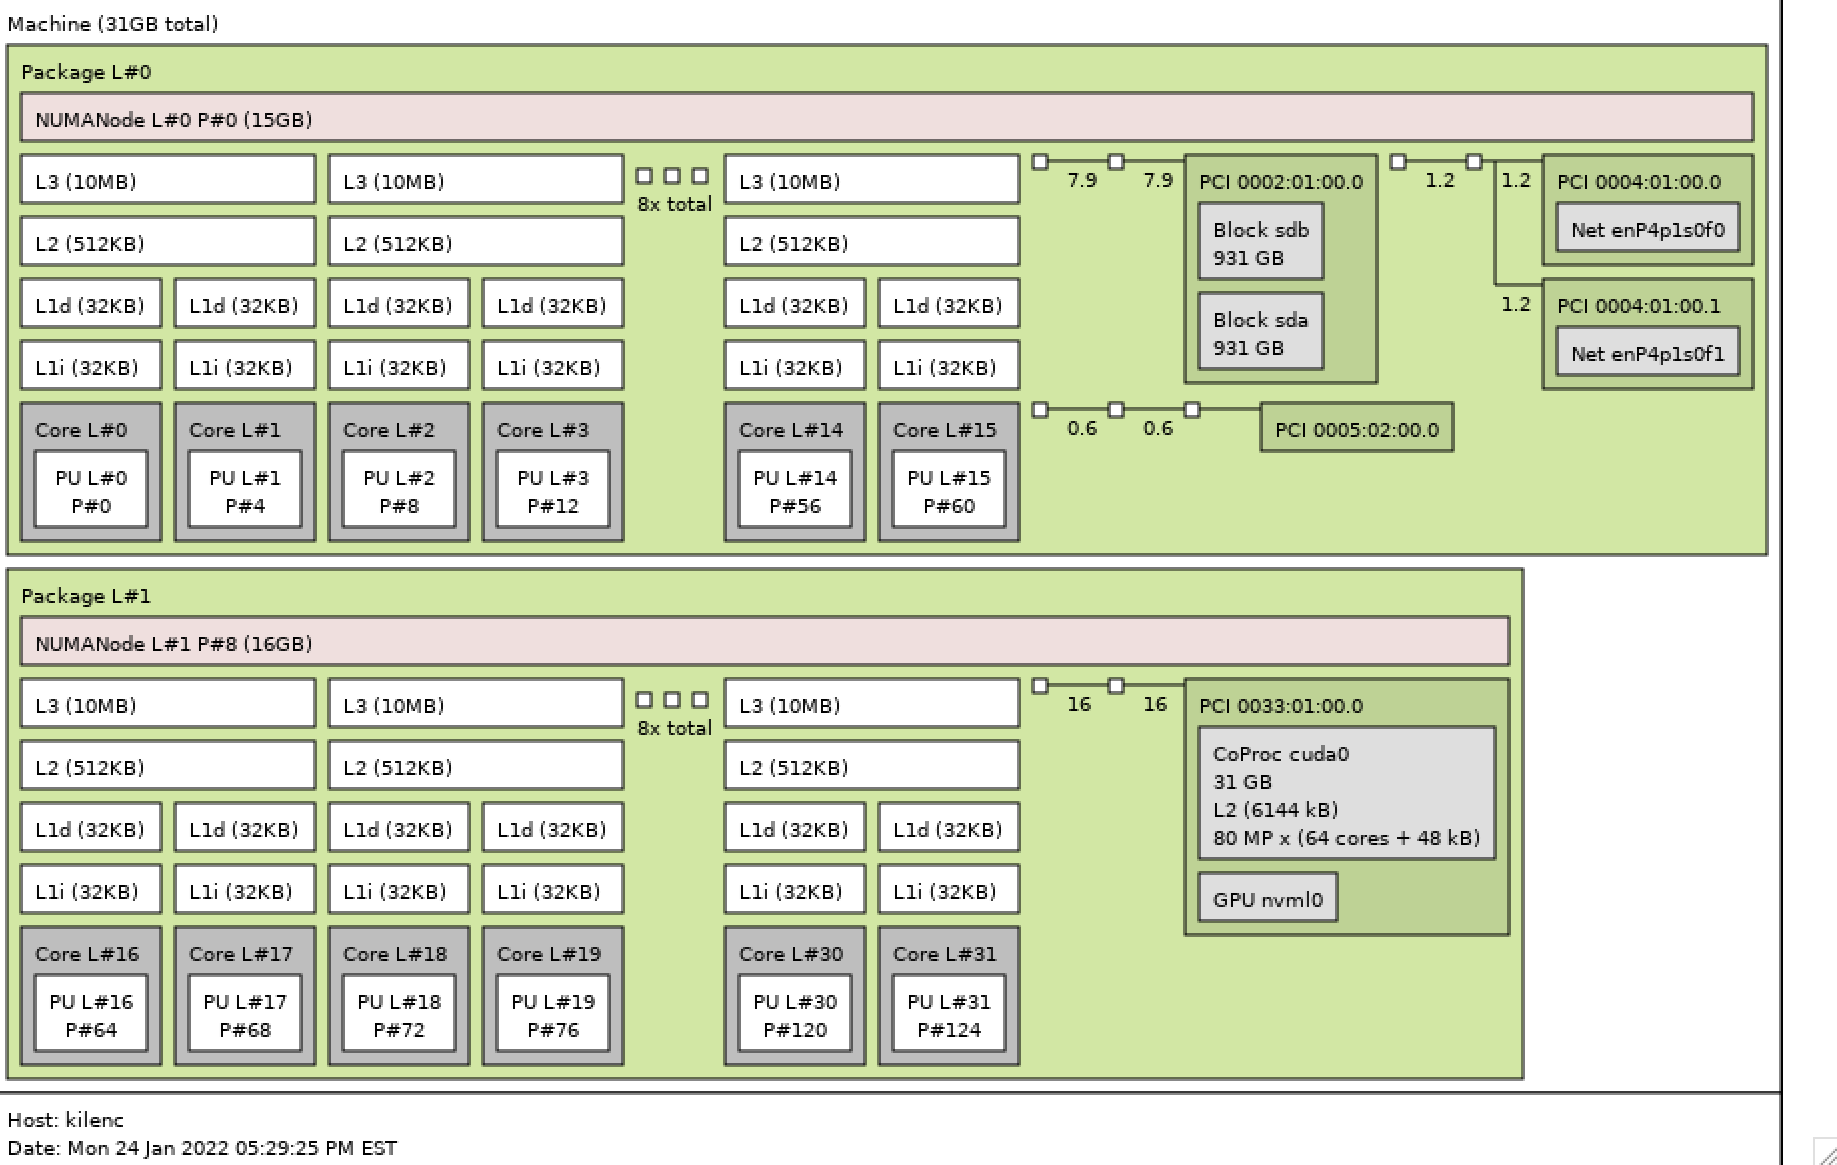
Processor and memory affinity with LSF
Next, let’s look at some examples of how processor and memory affinity can be controlled with IBM Spectrum LSF. LSF is a complete workload management solution for high-performance computing (HPC).
In the examples below, the well-known benchmark High-Performance Linpack (HPL) is run. Please note the following:
- HPL has not been optimized here and used only as an example.
- HPL was compiled against Open MPI version 4.1.2
- Open MPI version 4.1.2 was compiled with support for LSF
Next, we submit a run of HPL requesting 16 processor cores, all on the same NUMA node, with the options specified to bind the tasks to the NUMA node and with memory affinity specified. For job submission, the LSF bsub command is used.
[gsamu@kilenc testing]$ bsub -n 16 -q normal -o /home/gsamu/%J.out
-R "affinity[core(1,same=numa):cpubind=numa:membind=localonly]" mpirun ./xhpl
Job <101579> is submitted to queue <normal>.
After the job starts, we can see it the list of processes (PIDs), as well as the memory utilization using the LSF bjobs command.
[gsamu@kilenc testing]$ bjobs -l 101579

Job <101579>, User <gsamu>, Project <default>, Status <RUN>, Queue <normal>, Co
                     mmand <mpirun ./xhpl>, Share group charged </gsamu>
Fri Jan 10 1821: Submitted from host <kilenc>, CWD <$HOME/hpl-2.3/testing>,
                      Output File </home/gsamu/101579.out>, 16 Task(s), Request
                     ed Resources <affinity[core(1,same=numa):cpubind=numa:memb
                     ind=localonly]>;
Fri Jan 10 1821: Started 16 Task(s) on Host(s) <16*kilenc>, Allocated 16 Sl
                     ot(s) on Host(s) <16*kilenc>, Execution Home </home/gsamu>
                     , Execution CWD </home/gsamu/hpl-2.3/testing>;
Fri Jan 10 1830: Resource usage collected.
                     The CPU time used is 24 seconds.
                     MEM: 2.9 Gbytes;  SWAP: 1 Mbytes;  NTHREAD: 55
                     PGID: 80693;  PIDs: 80693 80700 80702
                     PGID: 80707;  PIDs: 80707
                     PGID: 80708;  PIDs: 80708
                     PGID: 80709;  PIDs: 80709
                     PGID: 80710;  PIDs: 80710
                     PGID: 80711;  PIDs: 80711
                     PGID: 80712;  PIDs: 80712
                     PGID: 80713;  PIDs: 80713
                     PGID: 80714;  PIDs: 80714
                     PGID: 80715;  PIDs: 80715
                     PGID: 80716;  PIDs: 80716
                     PGID: 80717;  PIDs: 80717
                     PGID: 80718;  PIDs: 80718
                     PGID: 80719;  PIDs: 80719
                     PGID: 80720;  PIDs: 80720
                     PGID: 80721;  PIDs: 80721
                     PGID: 80722;  PIDs: 80722


 MEMORY USAGE:
 MAX MEM: 2.9 Gbytes;  AVG MEM: 1.4 Gbytes

 GPFSIO DATA:
 READ: ~0 bytes; WRITE: ~0 bytes

 SCHEDULING PARAMETERS:
           r15s   r1m  r15m   ut      pg    io   ls    it    tmp    swp    mem
 loadSched   -     -     -     -       -     -    -     -     -      -      -
 loadStop    -     -     -     -       -     -    -     -     -      -      -

 RESOURCE REQUIREMENT DETAILS:
 Combined: select[type == local] order[r15s:pg] affinity[core(1,same=numa)*1:cp
                     ubind=numa:membind=localonly]
 Effective: select[type == local] order[r15s:pg] affinity[core(1,same=numa)*1:c
                     pubind=numa:membind=localonly]
During the job runtime, we use the ps command to check which processor cores the xhpl processes are bound to (see PSR column). It should be noted that LSF also creates a cgroup cpuset for this job.
[gsamu@kilenc testing]$ ps -Fae | grep xhpl
UID         PID   PPID  C    SZ   RSS PSR STIME TTY          TIME CMD
gsamu     80702  80700  0  2884 31936  36 18:46 ?        0000 mpirun ./xhpl
gsamu     80707  80702 97 10471 387072  4 18:46 ?        0021 ./xhpl
gsamu     80708  80702 97 10619 396672 20 18:46 ?        0021 ./xhpl
gsamu     80709  80702 97 10345 378816 56 18:46 ?        0021 ./xhpl
gsamu     80710  80702 97 10596 395200  8 18:46 ?        0021 ./xhpl
gsamu     80711  80702 97 10470 387072 48 18:46 ?        0021 ./xhpl
gsamu     80712  80702 97 10619 396672 44 18:46 ?        0021 ./xhpl
gsamu     80713  80702 97 10351 379136 12 18:46 ?        0021 ./xhpl
gsamu     80714  80702 97 10322 377472 24 18:46 ?        0021 ./xhpl
gsamu     80715  80702 97 10350 379328  0 18:46 ?        0021 ./xhpl
gsamu     80716  80702 97 10494 388736 60 18:46 ?        0021 ./xhpl
gsamu     80717  80702 97 10232 371648 40 18:46 ?        0021 ./xhpl
gsamu     80718  80702 97 10205 370048 28 18:46 ?        0021 ./xhpl
gsamu     80719  80702 97 10321 377536 52 18:46 ?        0021 ./xhpl
gsamu     80720  80702 97 10465 387008 36 18:46 ?        0021 ./xhpl
gsamu     80721  80702 97 10200 369664 16 18:46 ?        0021 ./xhpl
gsamu     80722  80702 96 10461 386560 32 18:46 ?        0021 ./xhpl
gsamu     80879  36562  0  1736  2816  80 18:46 pts/1    0000 grep --color=auto xhpl
Cross referencing the above list of CPU cores with the output of numactl, we see that the job is running on NUMA node 0.
[gsamu@kilenc testing]$ numactl -H
available: 2 nodes (0,8)
node 0 cpus: 0 4 8 12 16 20 24 28 32 36 40 44 48 52 56 60
node 0 size: 15245 MB
node 0 free: 944 MB
node 8 cpus: 64 68 72 76 80 84 88 92 96 100 104 108 112 116 120 124
node 8 size: 16242 MB
node 8 free: 5607 MB
node distances:
node   0   8
  0:  10  40
  8:  40  10
The LSF bhosts command also provides an affinity option (–aff) to display the NUMA bindings. Below is the output from that command. The * denotes that there are tasks pinned.
[gsamu@kilenc testing]$ bhosts -aff
Host[30.7G] kilenc
    NUMA[0: 0M / 14.8G]
        Socket0
            core0(*0)
            core4(*4)
            core24(*8)
            core28(*12)
            core32(*16)
            core36(*20)
            core40(*24)
            core44(*28)
            core48(*32)
            core52(*36)
            core56(*40)
            core60(*44)
            core72(*48)
            core76(*52)
            core80(*56)
            core84(*60)
    NUMA[8: 0M / 15.8G]
        Socket8
            core2064(64)
            core2068(68)
            core2072(72)
            core2076(76)
            core2080(80)
            core2084(84)
            core2088(88)
            core2092(92)
            core2096(96)
            core2100(100)
            core2104(104)
            core2108(108)
            core2112(112)
            core2116(116)
            core2120(120)
            core2124(124)
Affinity is also crucial for GPU workloads. LSF provides advanced capabilities for scheduling of GPU workloads to NVIDIA devices. Below is an example of the LSF submission syntax that could be used to submit a machine learning training workload for exclusive execution on a single GPU with core affinity specified on the same NUMA node. In the case where a system is equipped with multiple GPUs, users could submit jobs using similar syntax and this would effectively isolate the GPU workloads from one another.
bsub -n 10 -R “affinity[core(same=numa):distribute=pack]” -gpu “num=1:mode=exclusive” ./train.pyWe’ve discussed NUMA concepts in brief and the ability to easily control CPU pinning and memory binding for jobs submitted to LSF. In HPC environments where performance is crucial, using these concepts can help to drive performance by preventing workloads from using the NUMA interconnect where feasible. That concludes this quick recap of affinity jobs in LSF. You can find out more about the capabilities of LSF in the online documentation.